1/ Our Researchers Analyzed the Prediction Markets Landscape in Q2 2026
👉 Prediction markets is the hottest category among VCs
👉 Open Interest is up 54% in June amid the start of FIFA World Cup
👉 @Kalshi became the absolute leader, @Polymarket holds strong in the 2nd place
👉 The market is fragmenting by verticals: sports, politics, crypto, and others
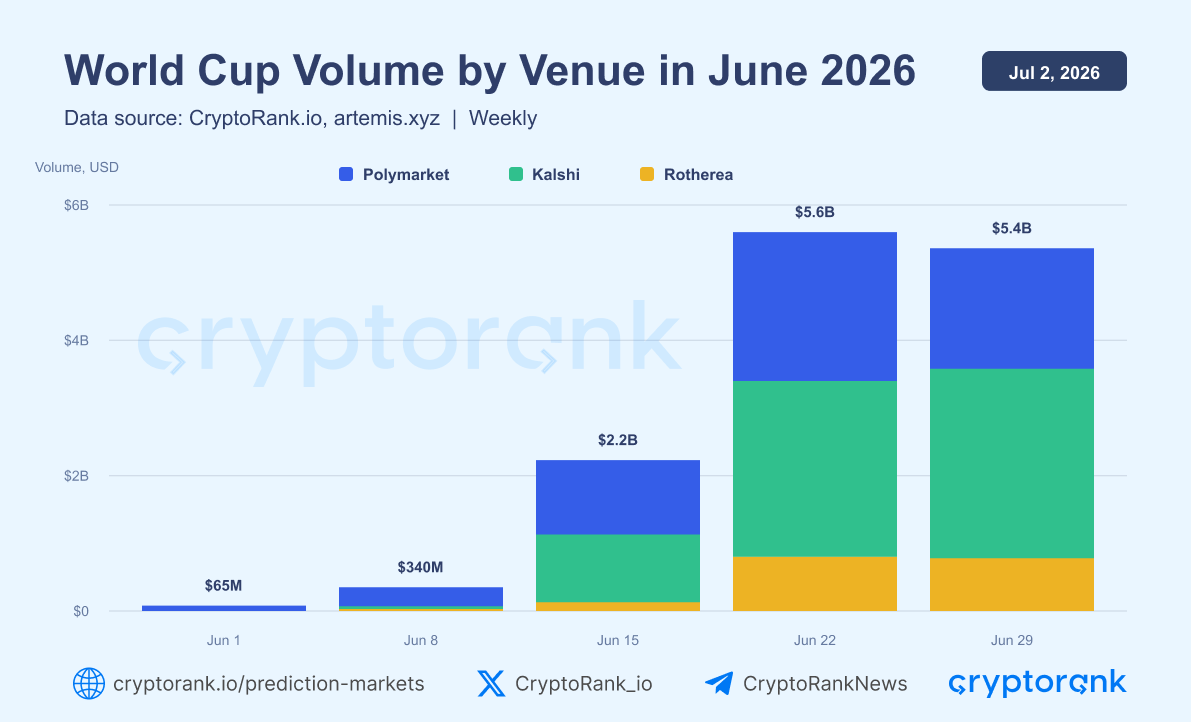
⚽️ World Cup Prediction Markets Volume Exploded in June
The volume on major venues raised from $65M on June 1st to $5.4B by June 29th, peaking at $5.6B on Jun 22.
@Kalshi led the surge, which shows how sports events can rapidly drive demand for prediction trading.
Fear Still Dominates Crypto Markets
The Crypto Fear & Greed Index closed H1 at 15 (Extreme Fear). Across the 181 days, the index spent all but one below the neutral line of 50.
Bitcoin had a few rally attempts, but investor sentiment remained overwhelmingly defensive.
📉Liquid Staking TVL Falls to a Two-Year Low
Total TVL across liquid staking protocols declined to $33.4B in Q2 2026, down 56.1% from its ATH of $76B recorded in Q3 2025.
The decline has now continued for three consecutive quarters:
• Q4 2025 — $61.4B
• Q1 2026 — $45.2B
• Q2 2026 — $33.4B
The trend highlights continued weakness across the DeFi ecosystem.
📊 Top BNB Chain Ecosystem Gainers in June
Despite the weak market environment, several @BNBCHAIN ecosystem tokens posted strong gains in June.
🥇 $BEAT led the ranking with +139%
🥈 $龙虾: +102%
🥉 $KOGE: +84.5%
🏅 $BAS: +81.4%
🏅 $SENTIS: +30.4%
📊 Perpetual DEXs continue to see strong trading activity.
@HyperliquidX remains the clear market leader with $254B in monthly trading volume — 4x higher than its closest competitor, @Aster_DEX ($61.2B).
Market volatility remains the key driver of perpetual futures activity.
📉 Ethereum Records Its First-Ever Three-Quarter Losing Streak
ETH finished Q2 2026 down 25.2%, extending its decline to three consecutive losing quarters — a first in Ethereum's history.
Since 2020, ETH has delivered positive returns in 16 of 26 quarters, with an average quarterly return of 20.1%.
⚽️ World Cup 2026 Helps Push Prediction Market Open Interest to $1.8B
Total open interest across prediction markets rose to $1.8B in June, up 54.3% MoM.
@Kalshi leads the market with $1.2B in open interest, accounting for 66.7% of total OI after a 91.9% monthly increase.
The 2026 FIFA World Cup, which began on June 11, is helping drive activity across prediction markets
📊The Number of Crypto Investors Has Fallen to a Six-Year Low
In Q2 2026, the number of unique crypto investors declined to 651, down from the ATH of 2,564 investors recorded in 2022.
The only period with fewer active investors was 2020, when quarterly participation ranged between 250 and 450 investors.
This trend suggests that venture capital in crypto is becoming increasingly concentrated among a smaller group of specialized investors, while overall market participation remains well below previous cycle highs.
Only Two Top-10 Assets Remain Positive in Q2 2026
$HYPE leads with a 72.6% quarterly gain, driven mostly by its June rally, which briefly pushed returns above 100%.
$TRX follows with a 4.1% gain, showing relative strength.
The rest remain negative for the quarter.
📈 Crypto M&A funding has increased 26x in just six months.
Capital deployed through crypto M&A transactions increased from $272M in Q4 2025 to $7.23B in Q2 2026, representing a more than 26x increase in just six months.
The growth has been remarkably consistent:
• Q4 2025 — $272M
• Q1 2026 — $2.14B
• Q2 2026 — $7.23B
📊 Q2 2026 Airdrops: Post-TGE Performance
Of the 8 airdrops analyzed, only 4 managed to increase their valuation after launch.
Top performers:
• @GeniusTerminal +120%
• @o1_exchange +77.9%
• @billions_ntwk +73.0%
• @re +64.5%
All four significantly outperformed their launch valuations.
📉 Crypto Fees Continue to Decline in 2026
The AVG decline reached 44.6%, while the median decline stood at 42.2%, highlighting a broad-based slowdown in user activity across the market.
The largest fee-generating sectors remain:
• #DEX — $1.10B (-52.5%)
• #L1 — $1.60B (-26.2%)
• #Derivatives — $551M (-36.6%)
• #Lending — $529M (-43.7%)
• #LiquidStaking — $503M (-42.2%)
DEX fees have been cut by more than half, while NFT marketplaces experienced an 82.5% decline.
📉 2026 YTD Market Breadth: June Could Become the Weakest Month of the Year
Out of 85 non-stablecoin assets:
• 87% declined
• 13% advanced
The share of declining assets reached its highest level of 2026.
Average return fell to -8.6%, while the median asset returned -12.3%, highlighting a broad-based market
AI Remains the Most Popular Funding Category in 2026
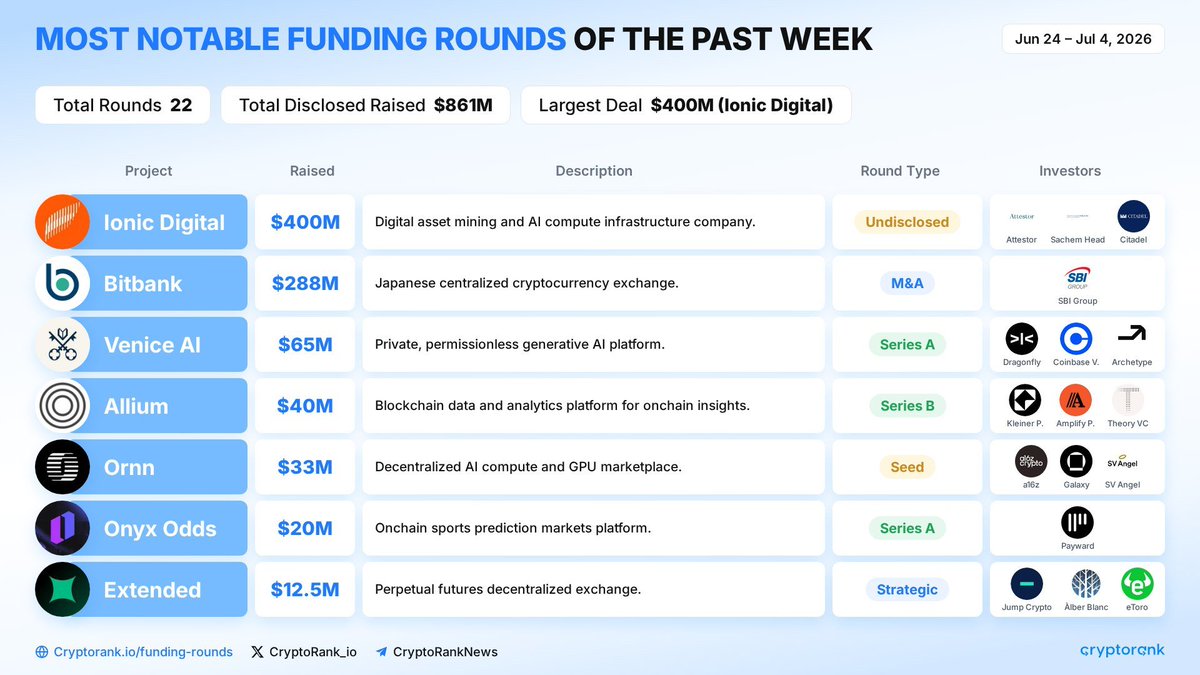
Late-stage funding reached $7.46B across 126 disclosed deals, compared to just $593M across 115 seed-stage rounds. This creates a 12.6x gap between late-stage and early-stage capital.
🏢 The largest late-stage category by funding was Prediction Markets, which attracted approximately $1.8B, significantly ahead of all other sectors.
🌱 At the seed stage the picture looks different:
#AI led all categories with $109M raised, narrowly ahead of DeFi ($101M) and Payments ($93.6M).
Active loans across major crypto lending protocols are down 42.3% YTD
📉 $35.3B → $20.4B
Despite widespread deleveraging, the market remains above $20B.
Top lending protocols by active loans:
@aave — $9.5B (46.5%)
@Morpho — $3.5B (17.1%)
@sparkdotfi — $1.6B (7.8%)
The lending sector is cooling, but it remains one of DeFi's largest markets.
⚡️ Base Ecosystem Reached 745 Projects, and $125B Market Cap.
Top 5 Base Ecosystem gainers (7D):
$AERO +26.6%
$KAITO +18.2%
$TIG +10.1%
$B3 +7.88%
$BRETT +5.36%
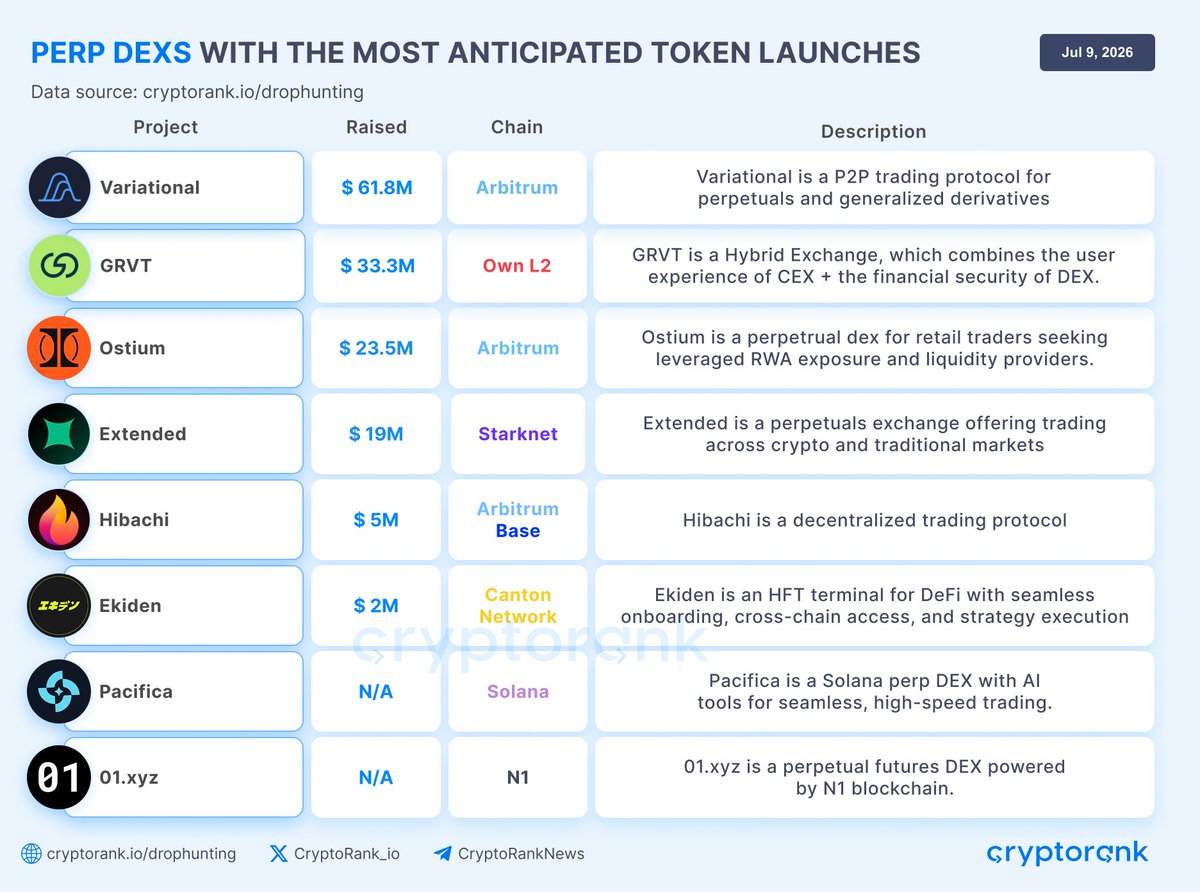
Track upcoming token launches and participate in airdrop campaigns across the Base ecosystem through the Drop Hunting section 👇
Seed & Pre-Seed Deals Have Nearly Halved Since 2021
Between January 1 and June 17, the number of funding rounds declined from 654 in 2021 to 402 in 2026 (-38.5%).
The sharpest decline occurred at the early stages:
— Seed/Pre-Seed: 265 → 135 (-49.1%)
— Series A+: 124 → 85 (-31.5%)
At the same time, Strategic rounds increased from 103 to 111 (+7.8%), suggesting a shift away from funding new ideas toward strategic partnerships and established businesses.
Investors are funding fewer experiments and allocating more capital to projects with proven traction and clearer business models.