My Math 110 professor mentioned a phenomenon: after they changed the way of filling in the class evaluation to online, the feedback they receive is either very good or very bad, which is bad for statistical purpose.
This the crime heat map we made for Berkeley city. It is very obvious that downtown Berkeley has more crime than the other places. Also, telegraph, Shattuck, and University Ave are not very safe.
#UCBStatWriting When my non-STEM friends could understand my Stat report, I felt my efforts paid off. Also, never expected we can show Stats to the public by so many types: journal, press release, blog, wiki, ... before I take the Stat writing class with @DebAtStat and @sastoudt!
After making the life expectancy vs. Private health spending (the first plot), I also did a test for potential outlier under assuming linear (the second and the third graphs, for those who may concern -- can be ignored), and found out the US is the only candidate for the outlier.
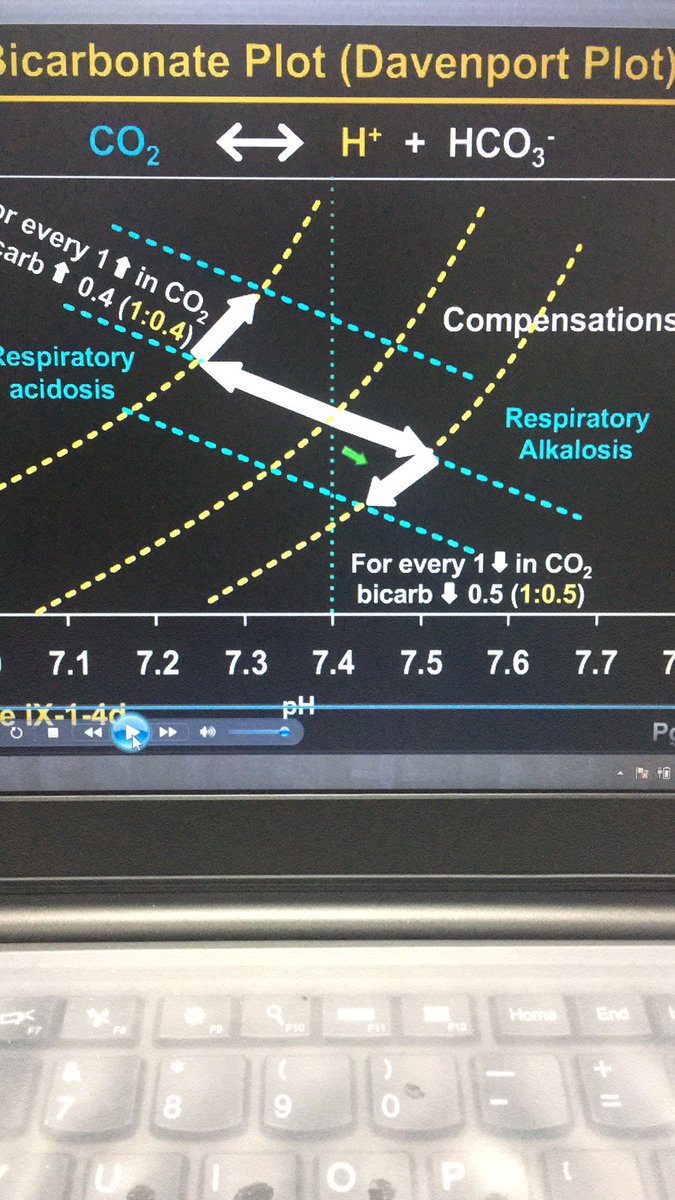
My friend sent this to me for complaining the unreadable graph in a video. It seems that it is hard for many people to use graph tools to convey statistics/scientific messages (this graph is even for educational purpose).
I am thinking about a question: why they can write a statistics blog post so fluently and easily, but I write for hours and only get a piece of disaster?...