Associate Professor (Biostatistics) @UWaterloo. Stats stuff. Trivia stuff. Disability stuff (mostly low-vision related). Sometimes known to win free coffee.
Hello new followers! You're probably here for the Roll Up stuff but some other things I talk about:
1. Stats! Contrary to some reports, winning free coffee isn't really my full-time job. I'm a biostatistician working on developing statistical methods to analyze health data.
Up in Ottawa for the second time in two months for @isi_wsc where literally every member of staff I have talked to was British and while I confess that's only an n = 3 situation it was still a bit unnerving
LRT it is definitely very normal when you first learn of a violent attack on your campus via the university subreddit which you only check every few days
My talk about my first experiences making general audience statistics videos has been uploaded - I'm by no means an expert so very much a 'here's what I learned', but hopefully some useful tips! https://t.co/GByluG7A4o
About to give a talk as part of the @michiganstateu Center for Statistical Training and Consulting data visualization seminar series, all about making introductory statistics videos - the talk is being recorded so hopefully online after! https://t.co/2qUEnTCQtG My best slide:
About to give a talk as part of the @michiganstateu Center for Statistical Training and Consulting data visualization seminar series, all about making introductory statistics videos - the talk is being recorded so hopefully online after! https://t.co/2qUEnTCQtG My best slide:
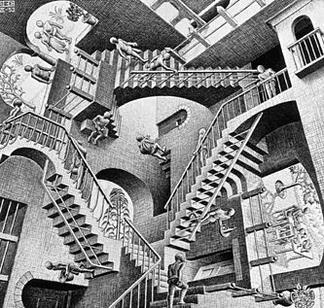
A useful diagram, and while certainly true that an inaccessible physical environment limits the visibility of disabled people in public spaces, it's important to note societal pressures that encourage disguising disability also contribute to the 'disability is rare' misconception
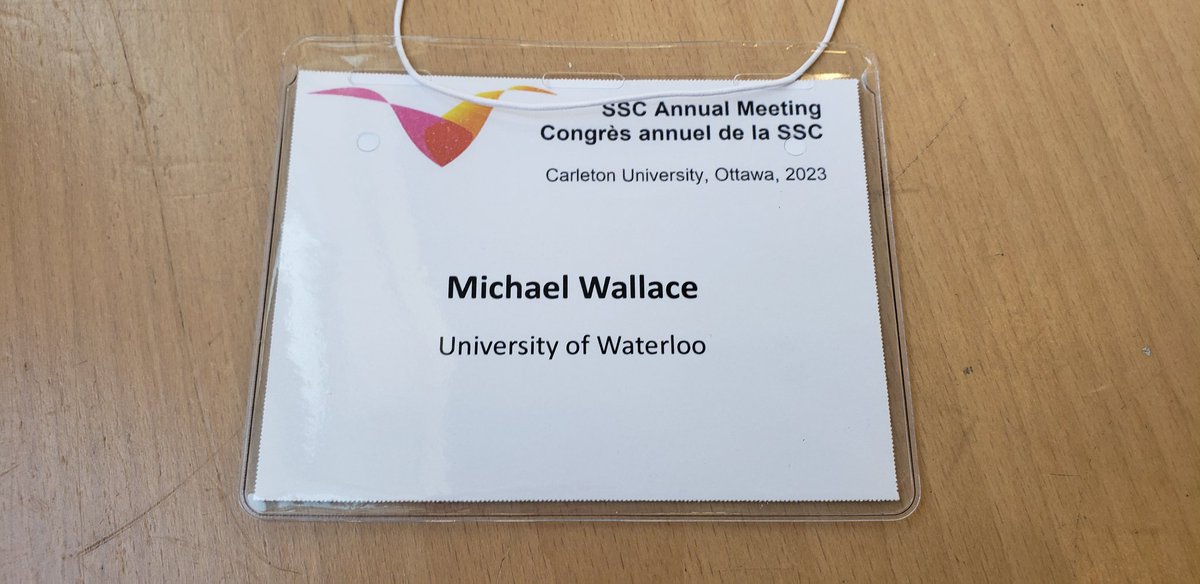
Whenever I see a conference uses an app my heart sinks. Not because I'm some luddite but because invariably these things are near impossible to use with low vision. Here are all the settings for this one - not even a dark mode :| @SSC_stat@WhovaSupport
#UWaterloo is proud to announce that a full tuition waiver will be offered to all qualifying students from two First Nation communities on whose traditional territory the University is situated.
More: https://t.co/mgAnIgoFyW | #UWaterlooNews
Twitter can you help with this data puzzle
A dataset of police stops includes subject race and whether a citation was issued. Race is missing for ~30%
Of those issued a citation, 3% have race recorded.
Of those not issued a citation, 97% have race recorded.
Any ideas why?
@DylanSpicker They *think* that during the earlier period there was a practice to record race information *if* no citation was issued, whereas in the latter period it's available for almost everyone, but there's no citation indicator for that time period
@DylanSpicker Oh, interesting - warnings presumably would be comparatively unlikely to record race (vs. citations), although still curious as to why race is being so reliably recorded for non-warnings/citations/arrests but then mysteriously missing for so many citations/warnings
@DylanSpicker I'm just looking at the Chicago dataset, which shows about 30% 'citation' - I'm now wondering if there's an issue with that variate since if across all locations it's a 5% citation rate, that would seem pretty odd for this location
Obviously a big caveat emptor for anything too complex, and you've got to check their work, but I'm finding it's a real game changer for basic data cleaning/processing
Slowly training myself to remember that LLMs exist when I'm coding - little isolated tasks that might take me 5-10 minutes of googling/thinking take 1-2 minutes via an LLM and those time saves *really* add up