Save for later,
- Now that even the most clueless retail investor has learned to pour money into the US stock market, it's not going to keep going up forever. 2026 is shaping up to be the period for a bigger correction.
- All the VUUA Greek investors will have a hard time facing reality.
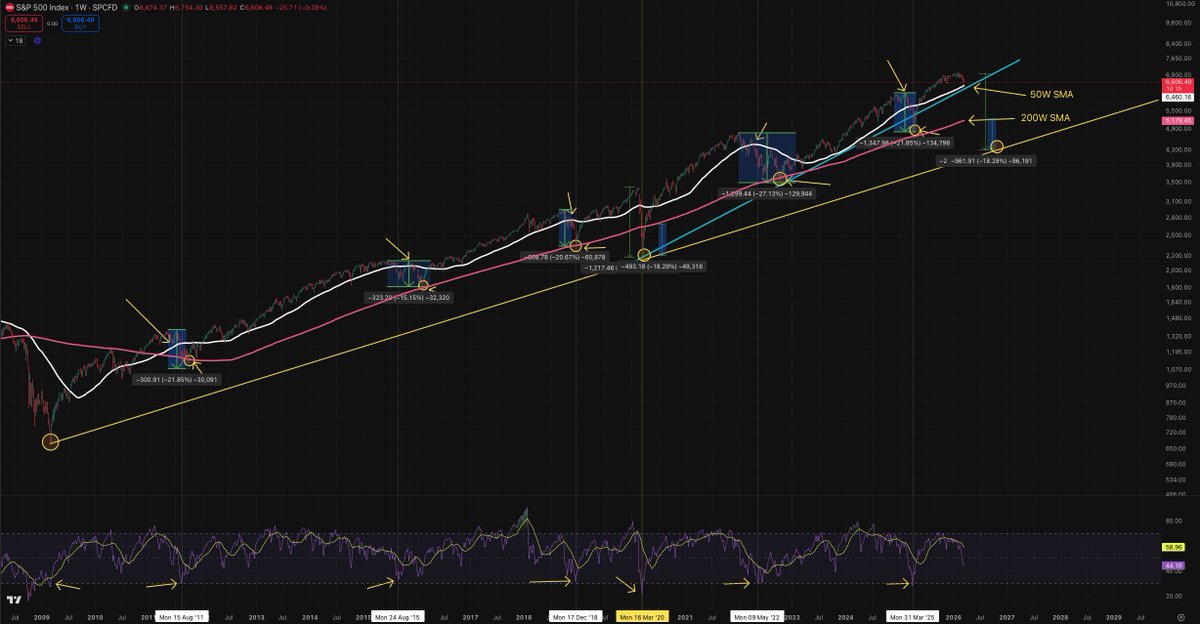
- Every time SPX loses the 50w SMA finds a support at 200w SMA.
- Lose 200w SMA and tap the macro trend which connects 2008 - 2020 historical corrections.
- SPX overlaid on Gold. Historically, SPX tops first, then Gold follows. 1974 and 2008 confirm this pattern.
- Last correction for gold incoming in 2026-2027 and then it will continue its way to 5 digits.
#SPX #Technicalanalysis #XAU #Macroanalysis
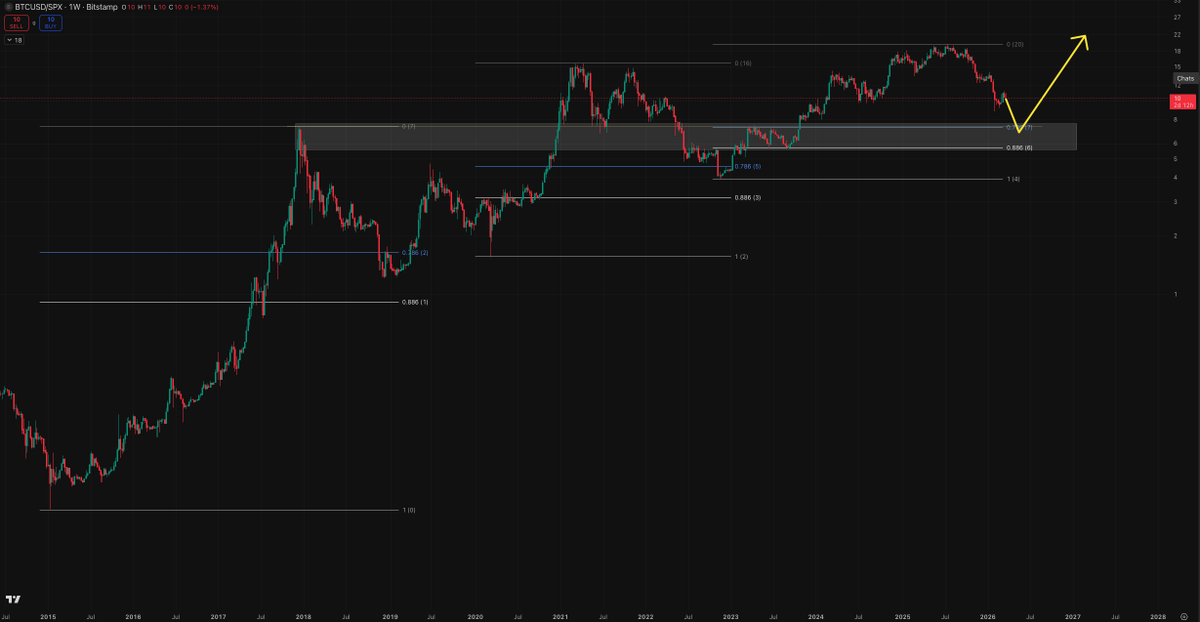
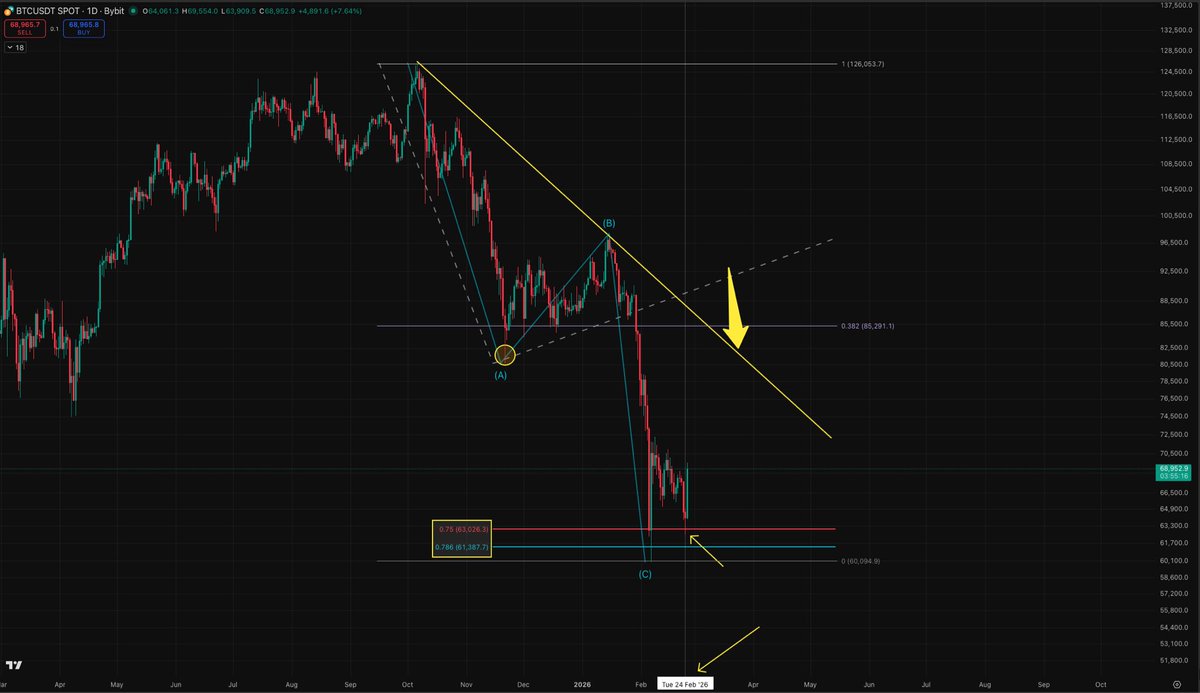
- The charts speak for themselves.
- Being right and making money are two different things.
- When the moment comes where your conviction aligns with what the chart is telling you, you have to act.
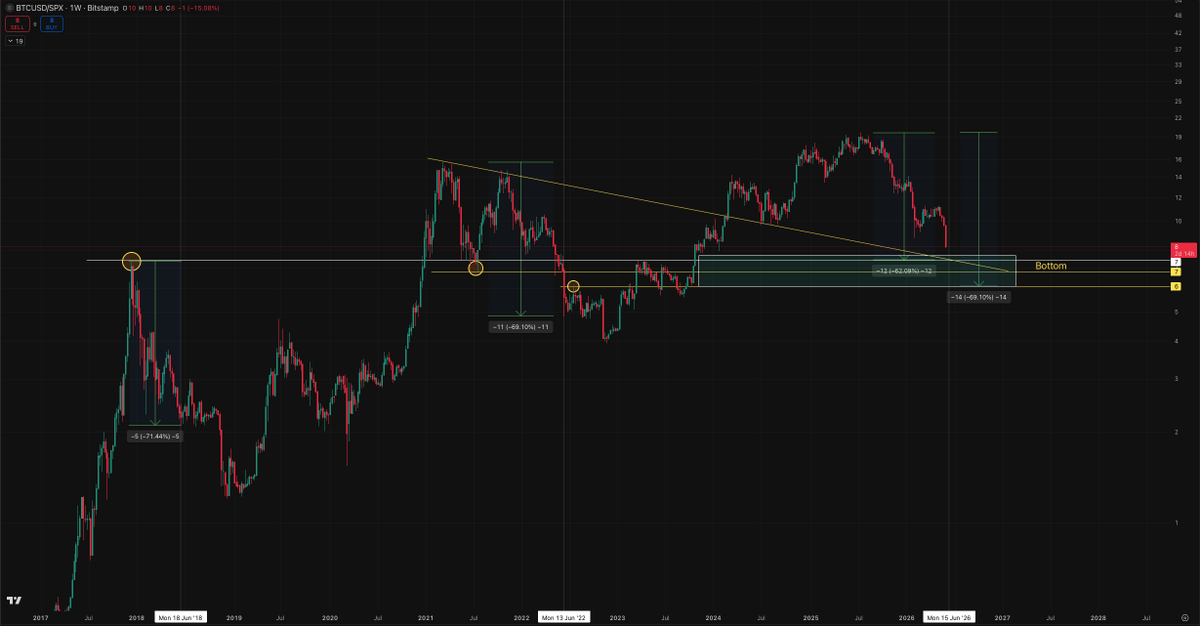
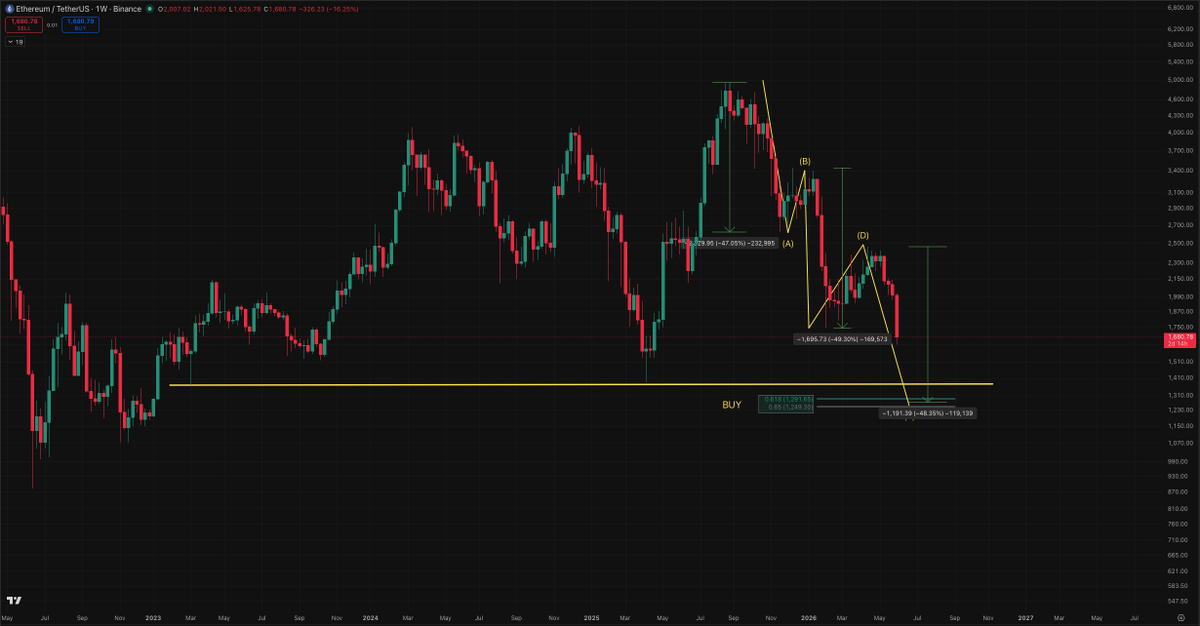
- We're approaching that point, and the risk/reward is starting to look attractive — both for a long-term position and a simple rebound trade.
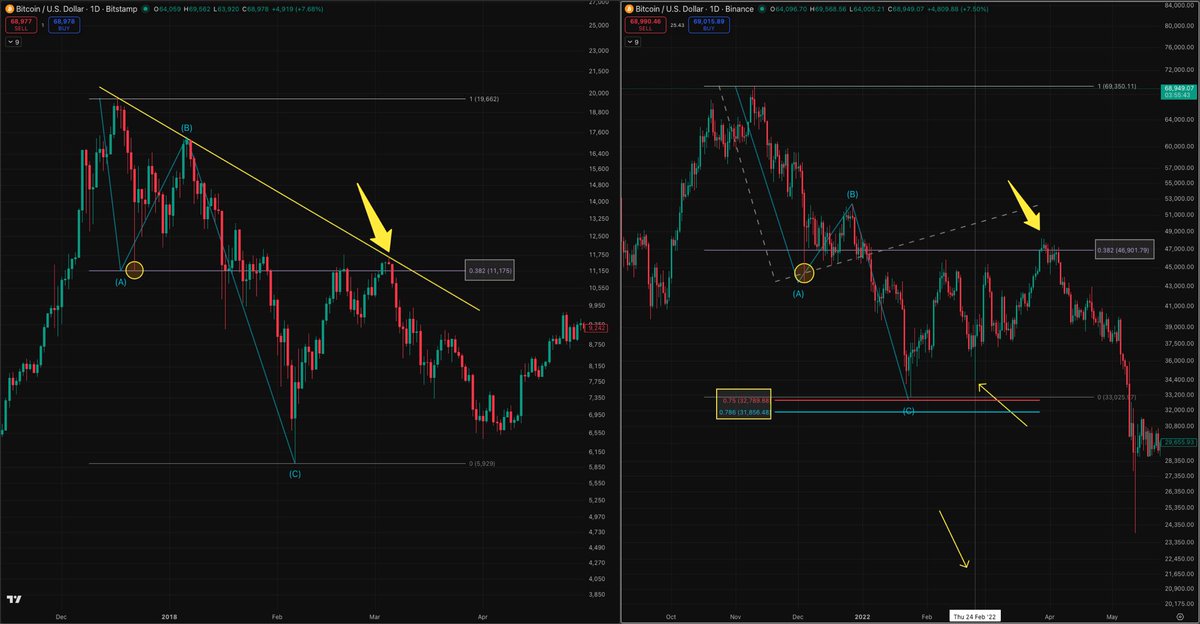
- The ideal scenario would be a sweep on ETH as the signal for a market-wide bottom, since the BTC sweep is close and almost a given at this point. Every time ETH gets a clean sweep, we get a BTC bounce. We're at critical timeframes right now. This is the moment where everyone decides for themselves — the noise doesn't matter anymore.
- Try not to get front-run.
#BTC #MarketCycles
Save for later,
- Now that even the most clueless retail investor has learned to pour money into the US stock market, it's not going to keep going up forever. 2026 is shaping up to be the period for a bigger correction.
- All the VUUA Greek investors will have a hard time facing reality.
- Every time SPX loses the 50w SMA finds a support at 200w SMA.
- Lose 200w SMA and tap the macro trend which connects 2008 - 2020 historical corrections.
- SPX overlaid on Gold. Historically, SPX tops first, then Gold follows. 1974 and 2008 confirm this pattern.
- Last correction for gold incoming in 2026-2027 and then it will continue its way to 5 digits.
#SPX #Technicalanalysis #XAU #Macroanalysis
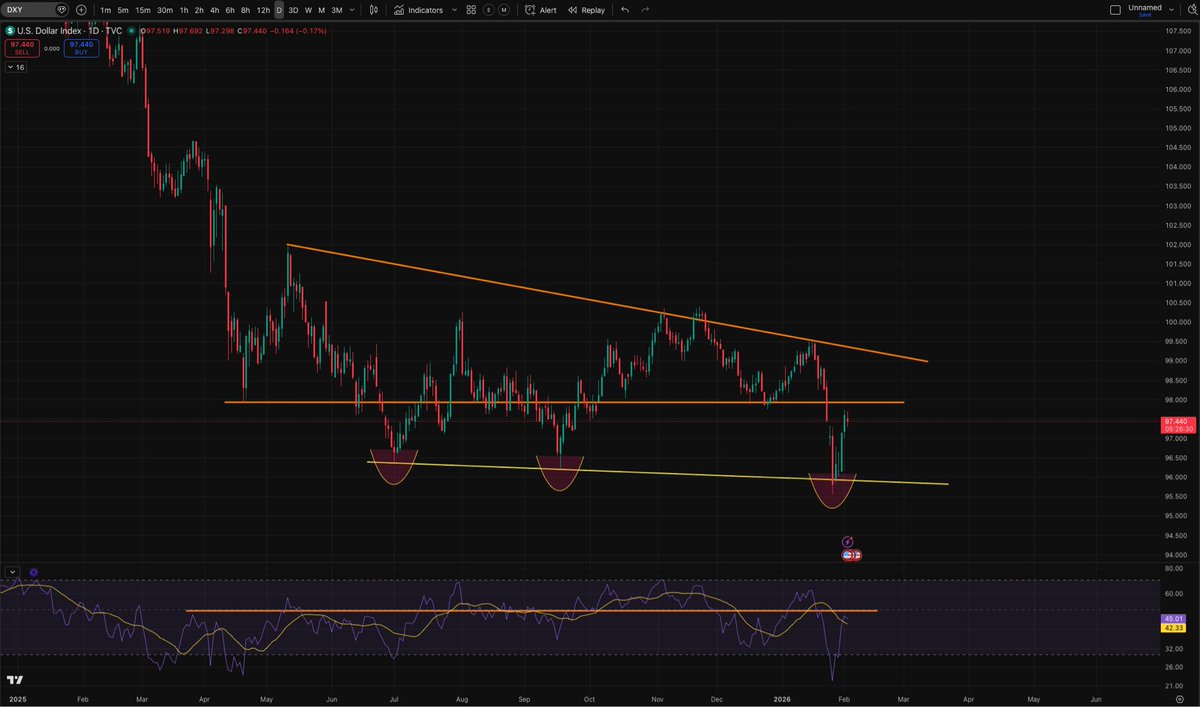
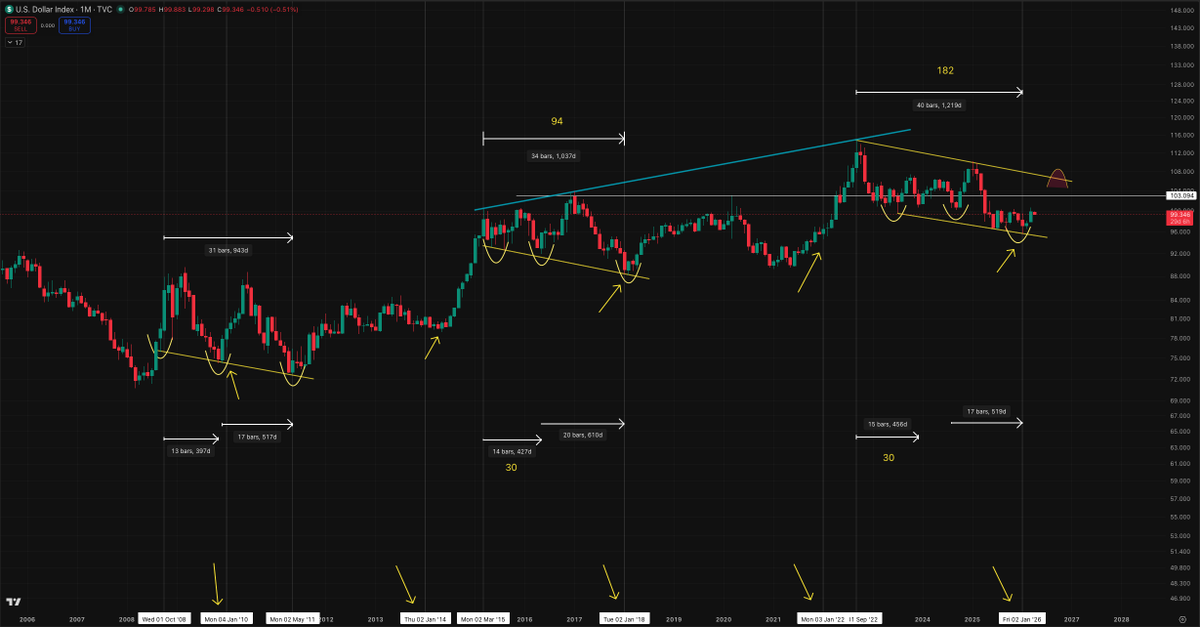
#DXY
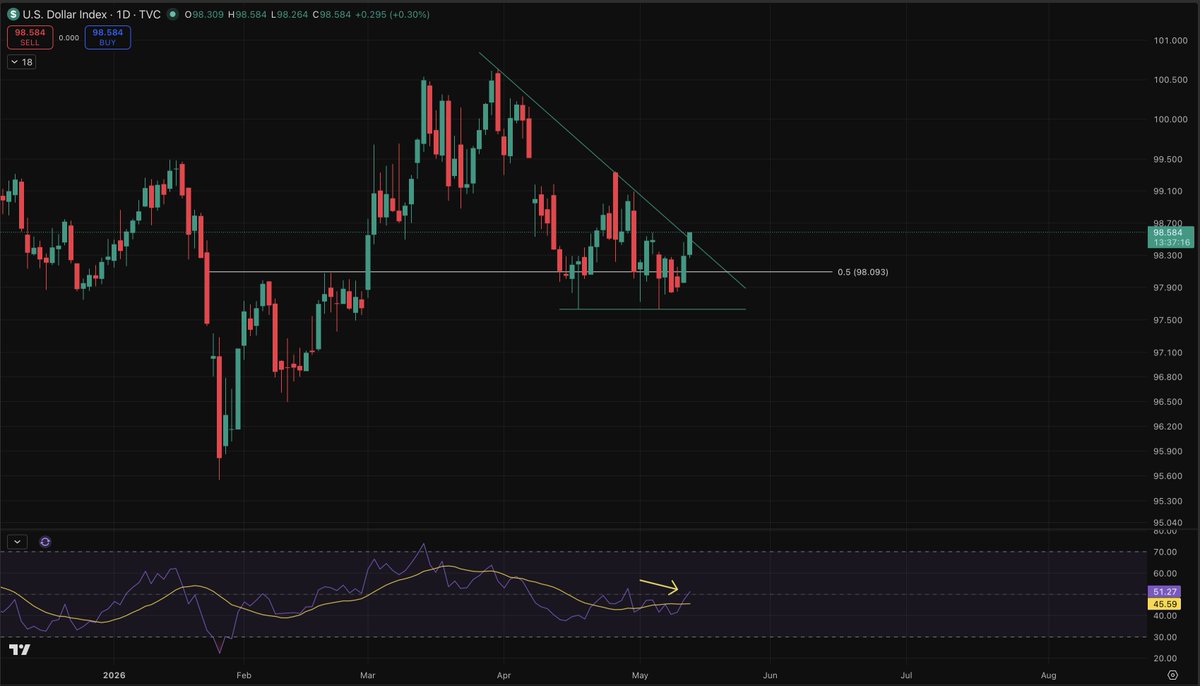
- DXY finds strength in midterm years. Every single time.
- 2010, 2014, 2018, 2022 — Q1 forms a low, then rallies.
2026 is a midterm year.
- Chart speaks for itself
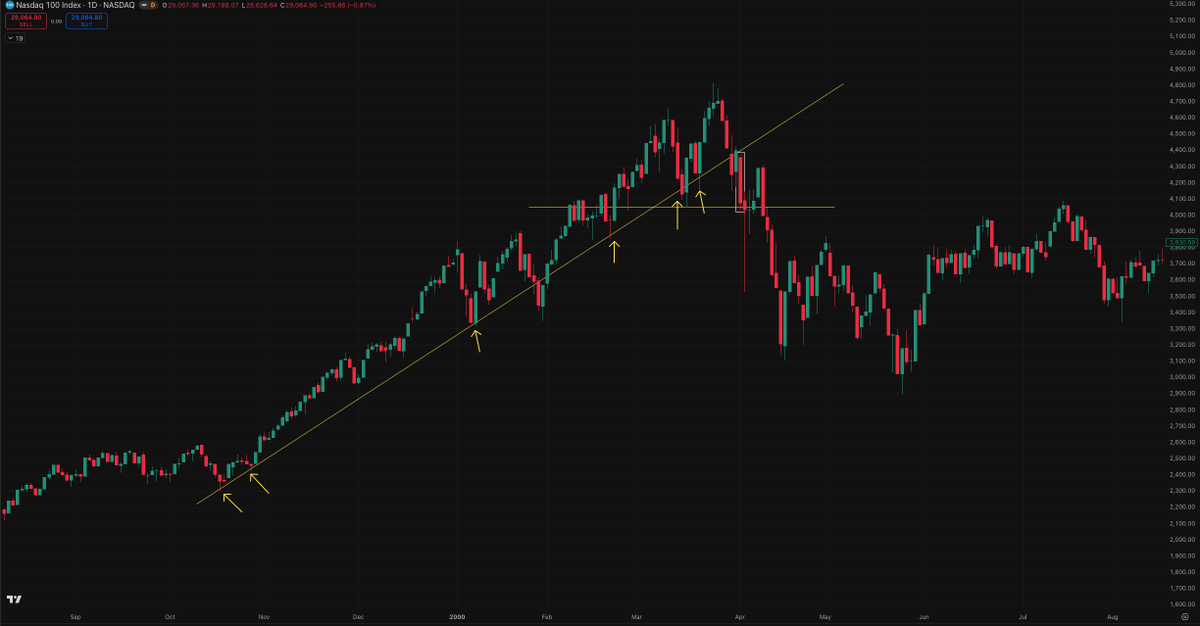
#NDX has a pattern.
- After every major uptrend, price forms a rounding top.
- Then, it gives a minor correction to trap the retail.
- A final explosive move follows to make everyone believe it will go up forever.
- That parabolic leg ends the same way every time: the moment its trendline breaks, a sharp correction follows.
Don't get shaken out trying to short the strength without at least this confirmation.
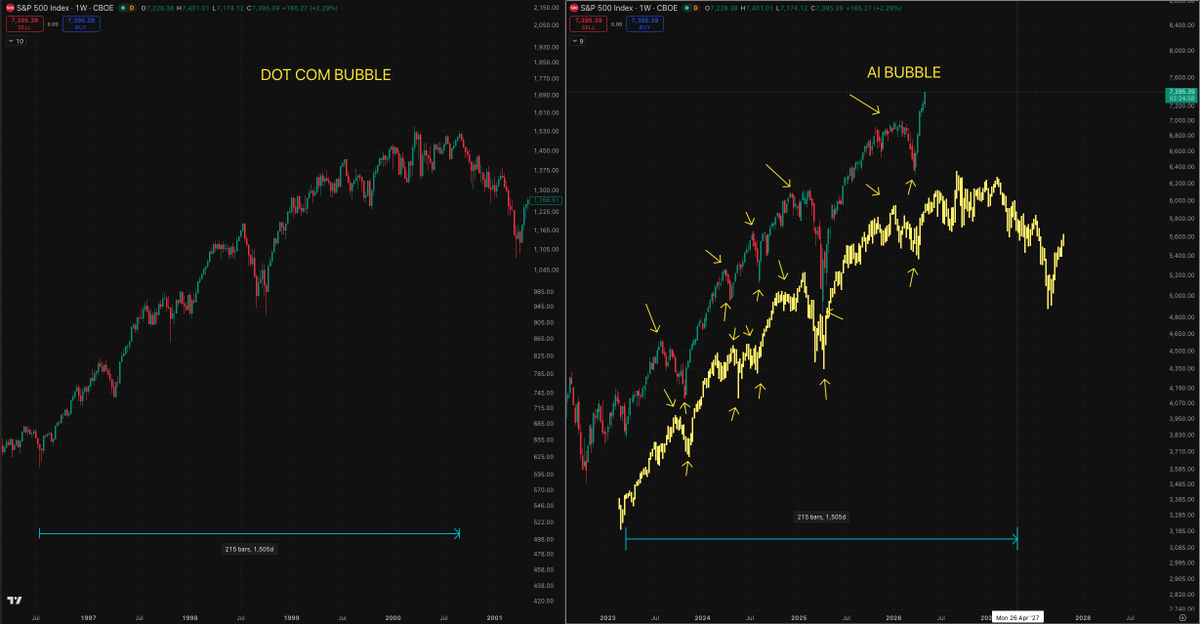
Red summer based on this Fractal,
- Let's see how extended things will get.
- Fundamentals don't support the current move — GDP missing estimates, inflation remains high, yet the chart keeps pushing higher.
- Is this a macro pivot, or are we watching the final stretch before gravity kicks in?
- Old market wisdom is becoming obsolete. "Sell in May and go away" — statements like these belong to a different era. The economy is experiencing a structural pivot.The old playbook no longer applies.
- AI has democratized knowledge — everyone now has access to the same data, the same charts, the same analysis. So knowledge alone is no longer your edge.
- The real edge? Understanding what everyone else can see — and positioning yourself to exploit it. When the crowd reads the same signals, the profit isn't in the signal itself, it's in knowing how the crowd will react to it.
- Good traders don't just analyze markets. They analyze the people analyzing the markets.
- Things will get harder from here. Adapt or get left behind.
- With CPI approaching, all charts are on the verge of a move that could define the next quarter.
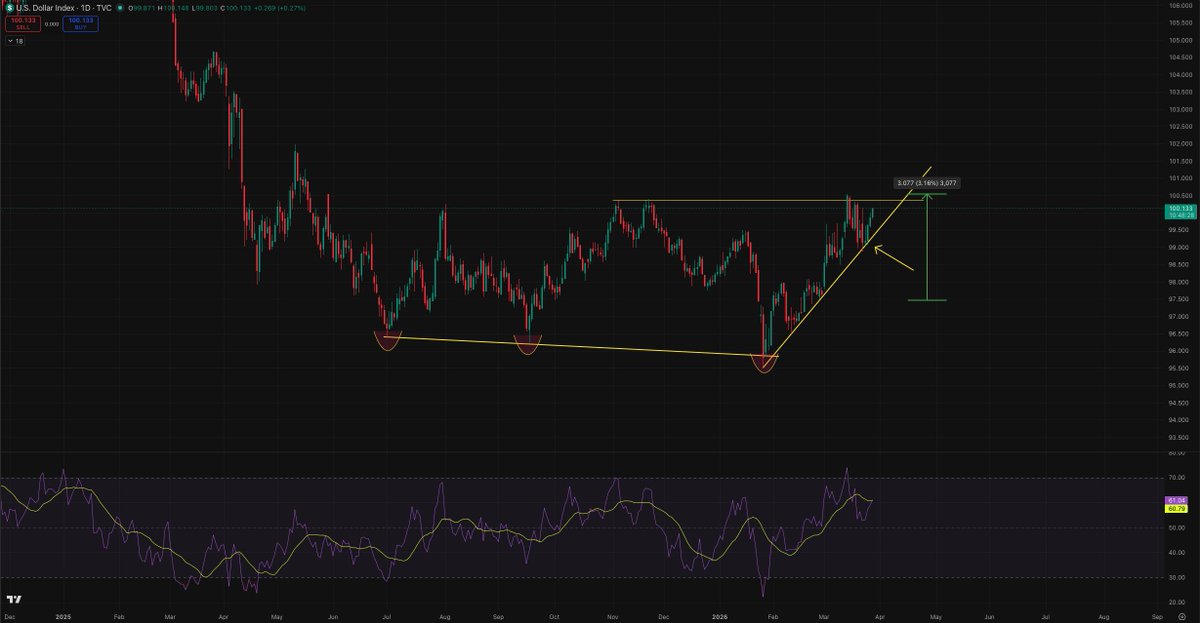
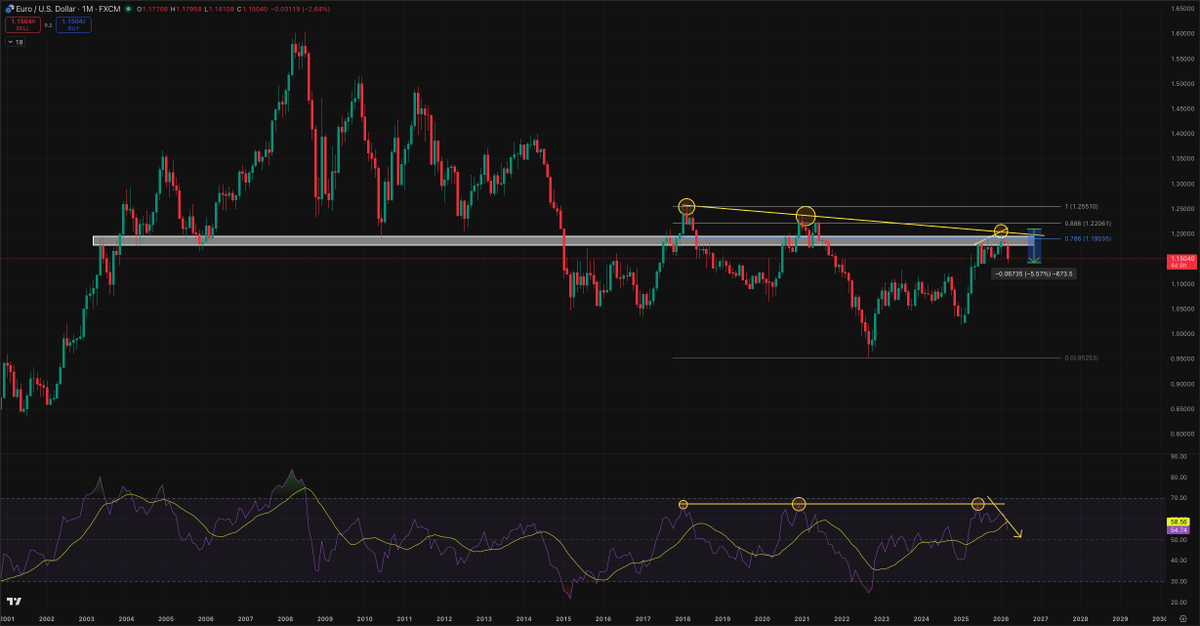
- SPX at resistance. EUR/USD exhausted. DXY coiling on support.
- With this geopolitical backdrop and the real data on the ground, it makes no sense for the market to push back into all-time highs.
- If it does, it won't last. It'll be a short deviation. A final liquidity grab before the real move down.
- But if we do get a push higher, it could easily be an irregular Wave B, an expanded flat designed to manipulate retail into chasing the breakout, before Wave C takes everything down.
- Second photo shows this extreme manipulation scenario.
#Macroanalysis #Stockmarket #SPX
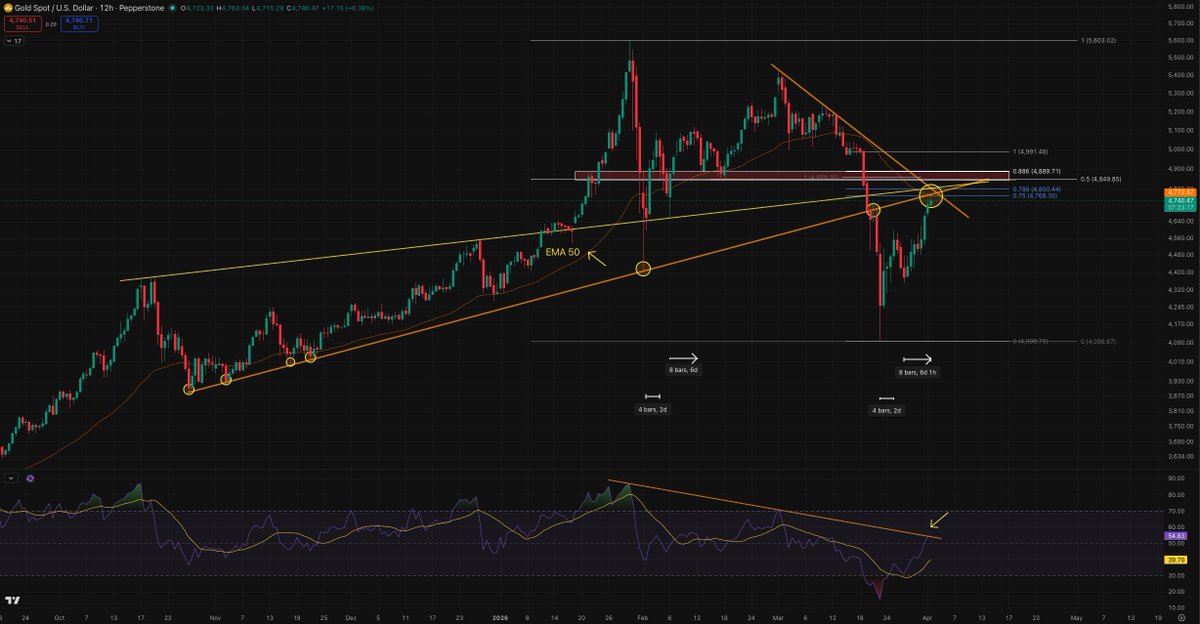
- A level everyone should pay attention to.
- This is do or die — if you're long from the bottom, it's a good time to take profits.
- With so many headlines hitting daily, timing becomes difficult.
#XAU#SPX#TechnicalAnalysis
- Some food for thought to those who understand Technical Analysis.
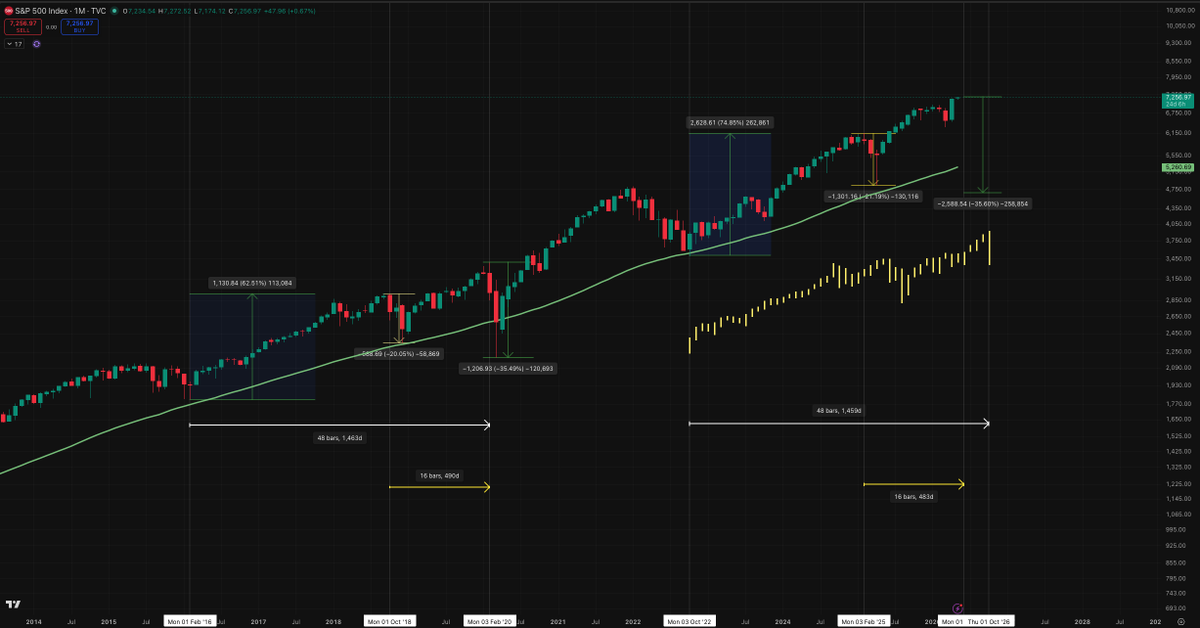
- Charts have 2 dimensions, yet most traders only analyze one. Time-based analysis is crucial.
#Stocks#Macroanalysis
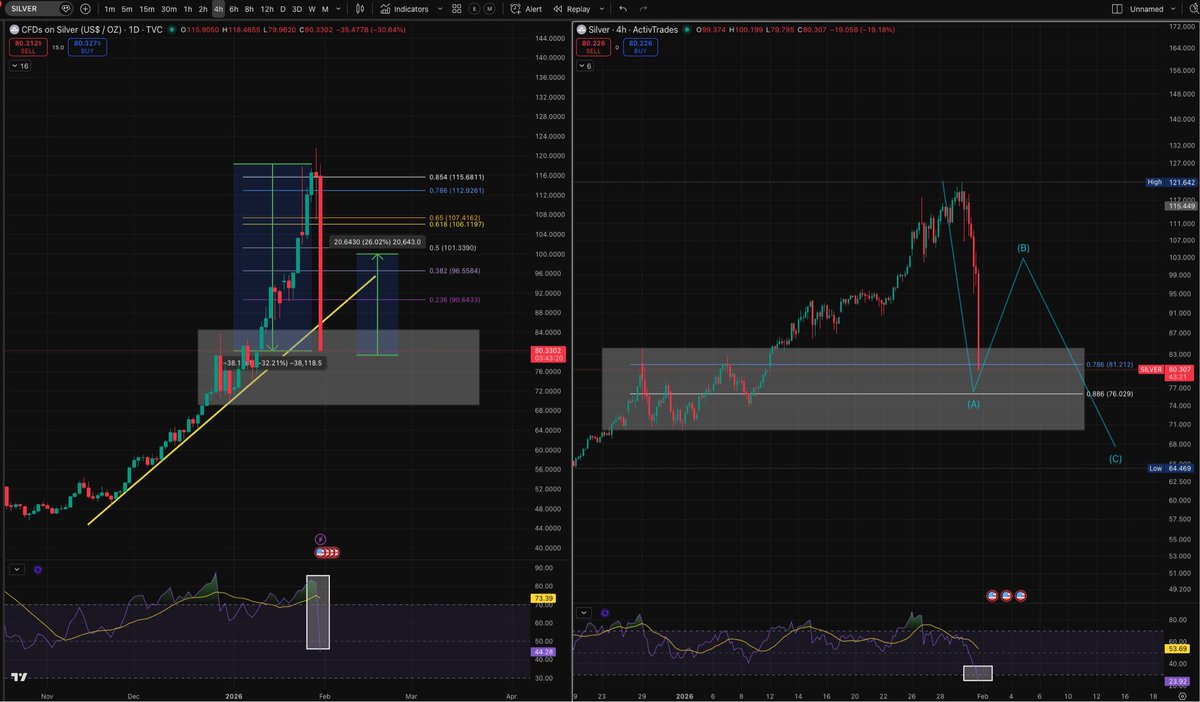
Silver is down more than 30% intraday, which is extremely unusual and rare. The entire white area represents spot buy zones for the upcoming rebalance. #Silver#XAGUSD .