@WhaleChart I'm from Argentina. It's easy to know why anyone in SBF position would come to this country. Argentina has the biggest number of "Cuevas" in the world by a large margin. It's an illegal decentralized exchange system to swap crypto (or any currency) for cash, mainly USD.
I posted this earlier in the week on @RealVision, but thought it was worth sharing here as well, just to give everyone something to think about.
If you step back and look at the data, something interesting is happening in markets right now…
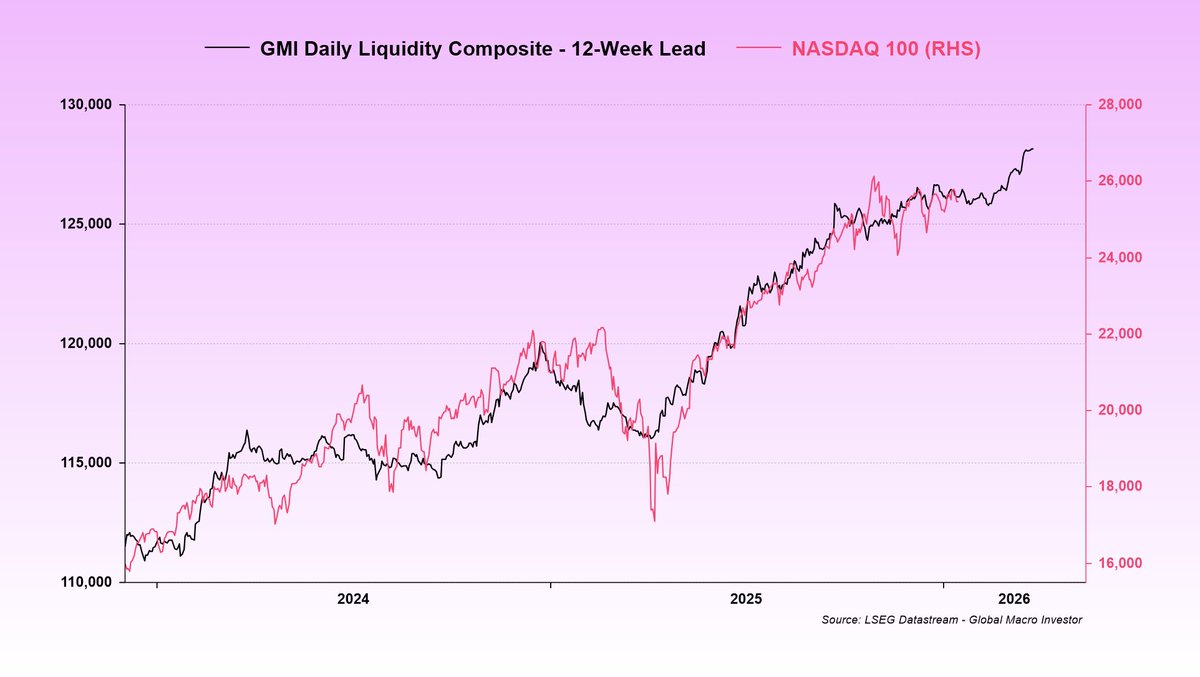
When you line up liquidity with equities, you get this (chart 1).
And then compare that with the same liquidity measure versus Bitcoin (chart 2), a simple truth emerges:
Both cannot be right...
Either equities are fundamentally mispricing liquidity despite trading near record highs, or Bitcoin is correctly signaling that the liquidity cycle has already peaked and that risk assets are about to roll over. Only one of these outcomes can ultimately be correct.
Now let’s separate data from opinion for a moment...
The data is clear:
Global liquidity has not yet peaked.
Now to my subjective view…
I think Bitcoin remains the outlier here, and that the events around 10/10 temporarily distorted price discovery, for reasons I’ve discussed at length previously.
Equities, credit, and broader risk assets are behaving exactly as you would expect in a rising liquidity regime. They’re hovering near all-time highs...
Bitcoin, by contrast, is pricing a liquidity peak that the data simply does not support at this stage.
At some point you have to step back and ask:
Is it more likely that one asset is right, or that every other BTC-correlated risk asset is wrong (chart 3)?
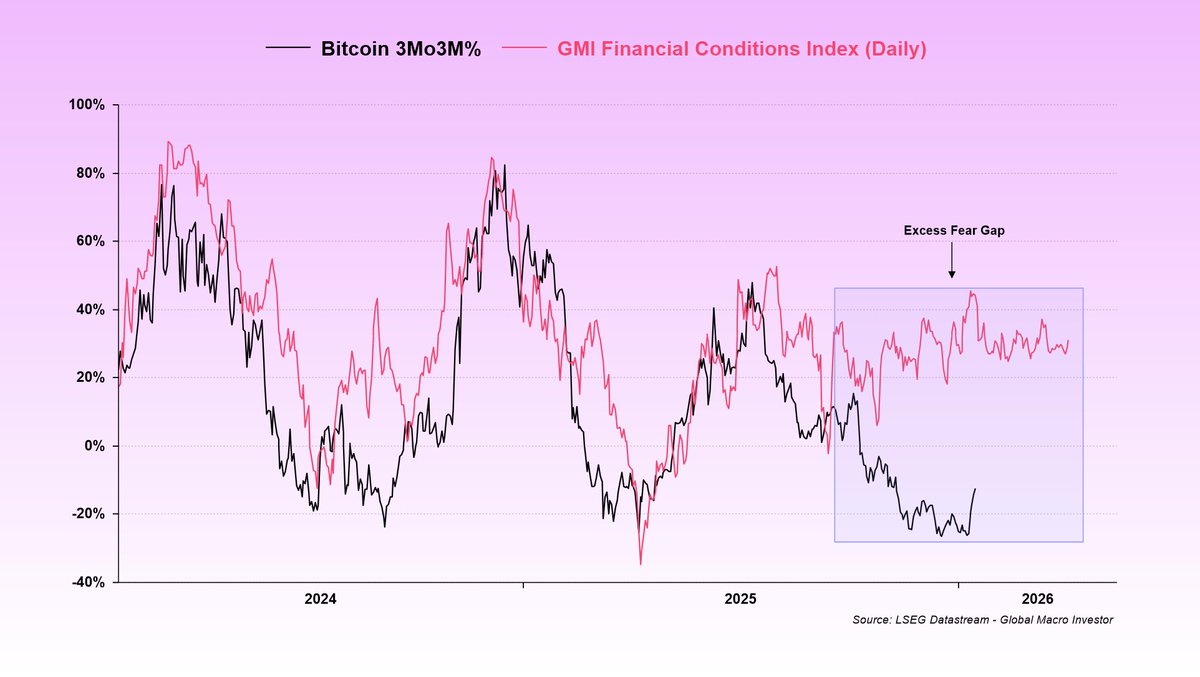
If you then layer in broader financial conditions, it stops being about opinion and becomes more about probabilities (chart 4).
What really stands out to me is the sheer magnitude of the “Excess Fear Gaps” that have opened up relative to the macro and liquidity fundamentals.
Right now, the weight of the evidence suggests liquidity is still rising and, in our view, will continue to rise, and that is what risk assets are reflecting.
That means Bitcoin is the anomaly.
What I’ve done here is present the data objectively and my view subjectively.
This is the battlefield for 2026.
The bull versus bear debate comes down to one thing and one thing only:
The direction of global liquidity...
I wanted to give everyone something meaningful, a gift…
This comes from Global Macro Investor (GMI) and a deep, long-running body of research developed by @RaoulGMI and myself.
Many of you already know The Everything Code, which is our framework for understanding the macro landscape and why major central banks are debasing their currencies to manage aging demographics and overwhelming debt loads.
I call this a gift because these four charts, while only scratching the surface of The Everything Code, give you the big-picture context you actually need in moments like this.
They stop you from getting lost in every Bitcoin pullback and explain why Raoul and I never panic, even when, to borrow one of his expressions, everyone’s acting like monkeys throwing poo at each other.
Once you understand The Everything Code, you stop trading short-term noise and expand your time horizon. You cannot unsee it.
The starting point is what we call The Magic Formula:
GDP growth = population growth + productivity growth + debt growth.
Population growth and productivity growth have been falling for decades. Debt growth is the only thing filling the gap.
The private sector has been deleveraging since 2008, mainly households, but debt levels are still around 120% of GDP. The public sector sits at roughly the same level.
Here’s the problem…
If the government is running debt at 100% of GDP and the private sector is sitting on another 100%, and for simple math we call rates 2% even though they are really closer to 4%, then the entire 2% trend growth of the economy is being consumed by servicing private-sector debts. That is a completely unproductive use of GDP. And then there’s the issue of public-sector debts. There’s just not enough organic growth to service the existing debt load.
To understand why this dynamic persists, you need demographics.
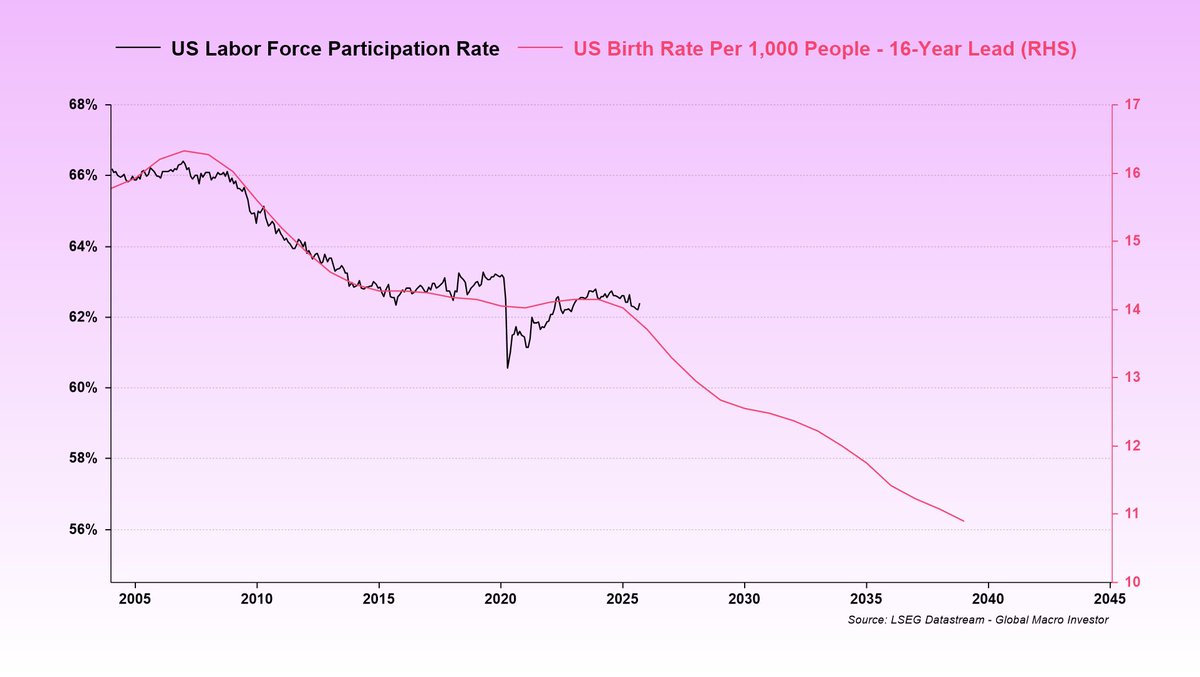
Birth rates peaked in the late 1950s and have been declining ever since. This shows up about sixteen years later in the labor force participation rate as each generation enters the workforce (chart 1).
That means the labor force participation rate is not going to rise any time soon. It is set to keep drifting lower. This is a structural problem.
Aging populations, falling birth rates, and rapidly expanding automation make the backdrop even more deflationary. AI and robotics are replacing humans at scale, and we are only at the beginning. This reinforces the need for ongoing stimulus to keep the system functioning.
With weak population growth and sluggish productivity, the only way to keep GDP expanding is through debt.
Now here’s where it gets interesting…
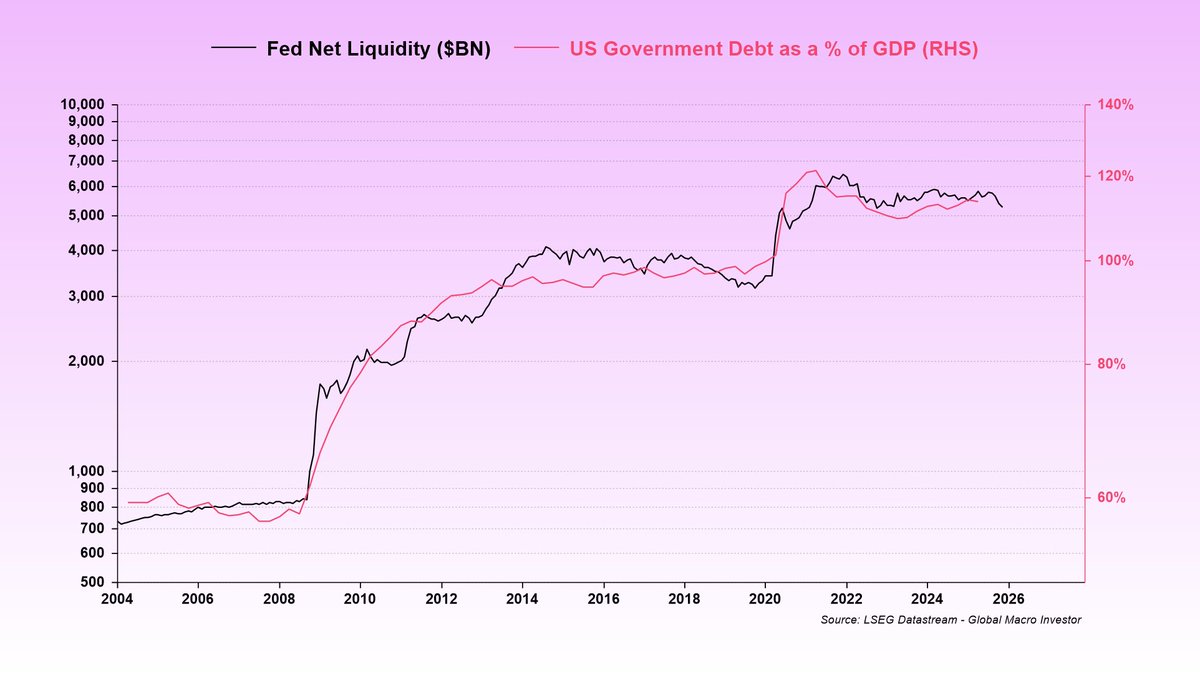
Government debt growth is completely offsetting the demographic decline and policymakers know exactly what they are doing (chart 2).
And what happens next?
All debt growth in excess of GDP gets monetized (chart 3).
Basically, since 2008, magic money has effectively been paying the interest. Governments issue new debt to cover old interest, and once rates fall enough, central banks absorb it onto their balance sheets.
So to wrap this up, demographics drive the decline in the labor force. Governments offset that decline with more debt. That debt eventually gets monetized through quantitative easing (QE) style operations, not always directly by the Fed, but through the coordinated ecosystem of the Fed, the Treasury, and the banking system. And the bottom line is that there’s still a massive wall of interest that needs to be monetized, far more than GDP can ever cover. Liquidity is literally the only game in town.
And what thrives in a world of perpetual debasement? Bitcoin (chart 4).
I know this correction has been painful, but it’s all part of the journey. These periods feel brutal in the moment, then they fade and the trend resumes. This too shall pass…
To quote Walter White from Breaking Bad, later echoed by @LynAldenContact, nothing stops this train.
MOAR COWBELL (liquidity) = number go up over time. Zoom out and be more bullish…
ISM correlation to Bitcoin
I find this correlation fascinating.
All 3 past Bitcoin cycle tops have broadly aligned with this monthly, oscillating index.
Based on what the ISM alone is showing, it looks like a cycle top could be mid-2026. This would be contrary to what most are expecting.
Could following it mean we miss the top, or catch the actual top better? No one has that answer.
I'm going to add this to the basket of metrics I keep an eye on for determining a BTC cycle top. I wouldn't rely on it alone, but I would consider it as part of the big picture.
I think Raoul Pal first spotted this, so he gets full credit. I do agree that it's very interesting.
Fintech sector is one of the fastest-growing and most promising, attracting a wave of high-tech companies. However, competition is intense, and identifying the market leaders is key.
The global fintech market is valued between $209.7B and $340.1B in 2024, with forecasts projecting it will exceed $1 trillion over the next decade. Analysts estimate a CAGR between 15% and 25%, driven by rapid digital transformation and innovation. According to Market Data Forecast, the market could grow from $209.7B to $1.58T by 2033, reflecting a 25.18% CAGR.
Digital adoption is the core growth driver. In 2024, digital payments reached $11.55 trillion, supported by high smartphone penetration and the global rollout of 5G.
AI, machine learning, and blockchain are transforming the sector by enabling personalized financial services, increasing operational efficiency, and strengthening cybersecurity.
Open banking and API integrations are accelerating collaboration between fintech companies and traditional banks, improving customer experience and speeding up product development.
Fintech is expanding beyond payments. The B2B2X segment is expected to reach $440B by 2030, growing at a 25% CAGR, as platforms play a larger role in embedded finance and business ecosystems.
Among publicly traded Fintech companies, analysts expect the strongest revenue growth in 2026 from: $DLO at +27%, $NU at +26%, $MELI at +25%, $ADYEN at +25%, $FOUR at +21%, $TOST at +20%, and $SOFI at +19%.
Mid-tier growth is forecast for: $WISE at +15%, $HOOD at +15%, $DOCN at +14%, $INTU at +12%, $BILL at +12%, $MA at +12%, $SQ at +11%, and $V at +10%.
Lower-tier growth expectations include: $FI at +8%, $STNE at +7%, and $PYPL at +6%.
Next, we’ll break down valuations relative to growth expectations and highlight a leading company in the space.