This chart should scare every bull right now. 📊
$SPY vs $IGV — 30 years of data.
Correlation: 0.98 😱
They move together. Almost perfectly.
Now look at the far right of the chart.
$IGV is rolling over hard. 🟥
$SPY hasn’t caught up yet.
But with a 0.98 correlation over 30 years —
history says it will. ⏳
Software doesn’t just drag itself down.
It drags the entire market with it.
This is not a sector rotation.
This is a warning signal for the broader market. ⚠️
When $IGV sneezes — $SPY catches a cold.
Right now $IGV has pneumonia. 😷
📊 Chart: https://t.co/RGS8XrMUR5
✨ Become a Member Today → https://t.co/RGS8XrMUR5
$SPY $IGV #SP500 #Software #TechnicalAnalysis #TradingEdge
$ES, $SPX
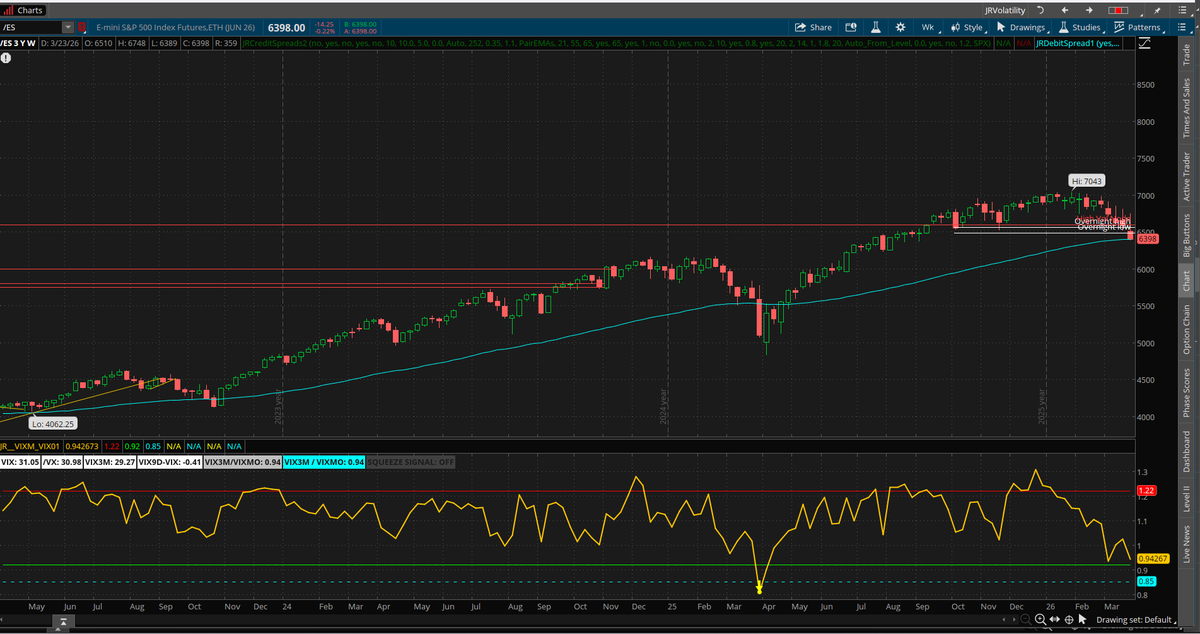
VIX3M/VIXMO rolling near key levels. Front-end stress stretched vs back-end.
Setup favors a pause or reflex bounce — not clean continuation.
ES vs ratio of VIX3M / VIXMO
$ES, $SPX, @MenthorQpro
Extreme VRP = downside expectations are overloaded.
This doesn’t signal a bottom, but it raises the odds of a sharp countertrend move.
$ES, $SPX
SPX is structurally damaged, in negative gamma and negative delta environment.
With VIX3M/VIX near an inflection (~0.95), the next move hinges on whether stress eases (>1.0 → squeeze) or accelerates lower.
Best approach: sell strength into 6475–6635 — this is a repair market, not a reversal.
https://t.co/KiZu8hwdoT
$ES, $SPX, @MenthorQpro
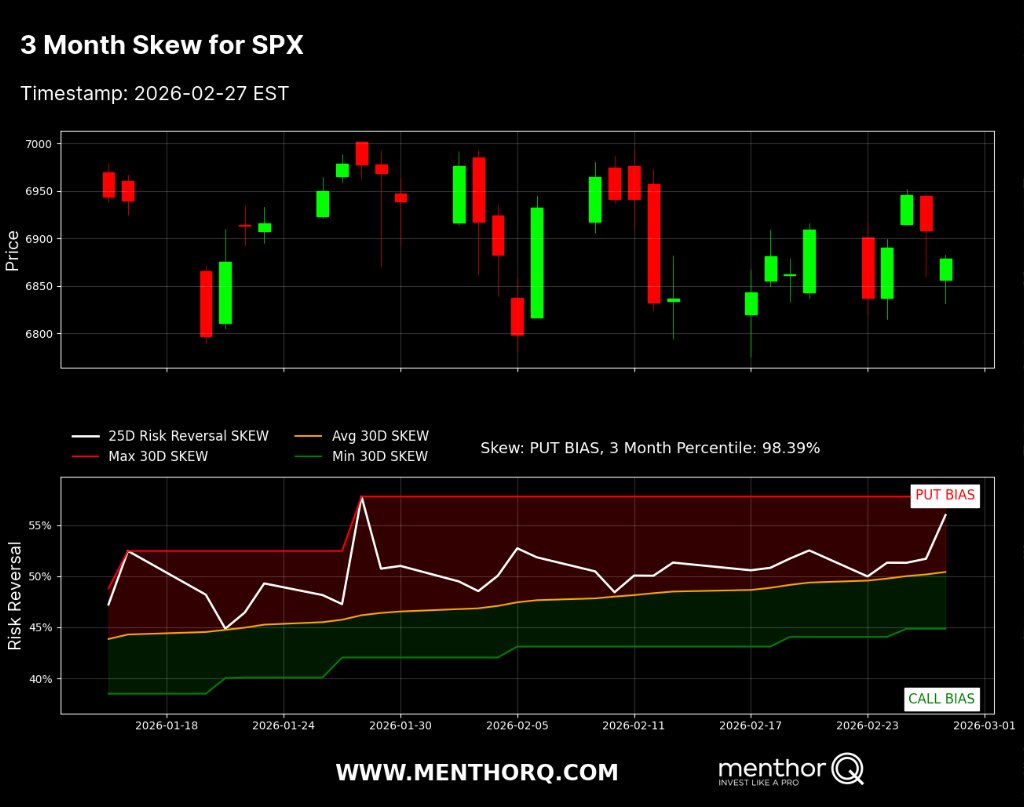
SPX 3-Month Skew: 98th percentile.
Downside hedging is crowded.
When protection gets this expensive, overshoots tend to snap back hard.
$ES, $SPX
7000 in play.
6800 is the line in the sand.
Value higher; Gamma thinner; NVDA midweek.
SPX roadmap + trade setup inside 👇
My weekly plan for $SPX, $ES
https://t.co/4RJkybLJun