#BTC | $BTC
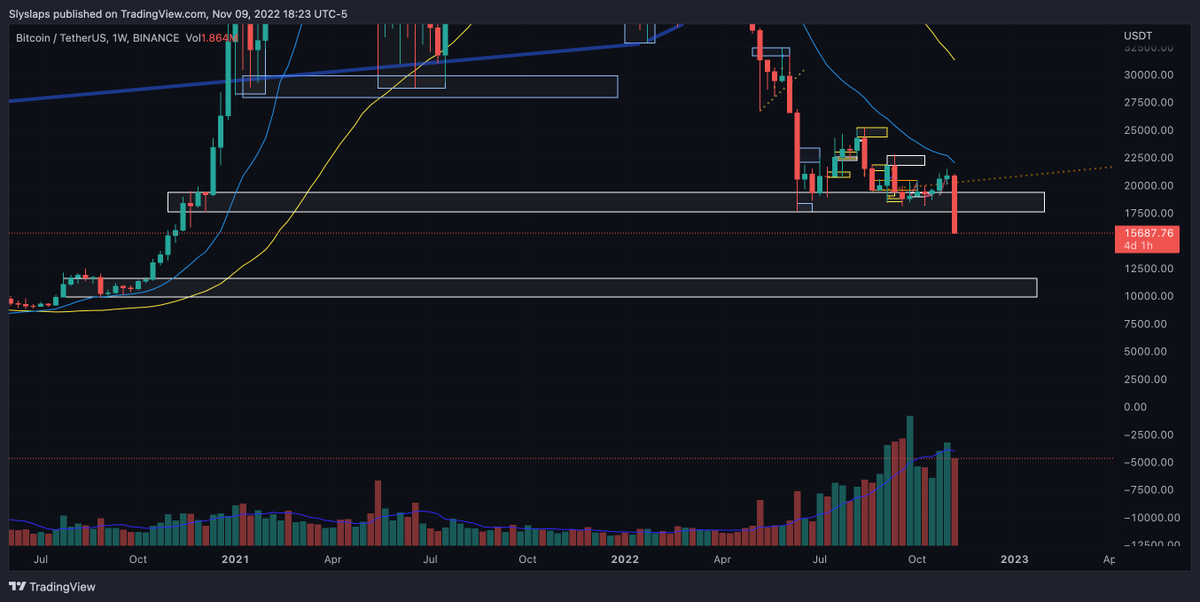
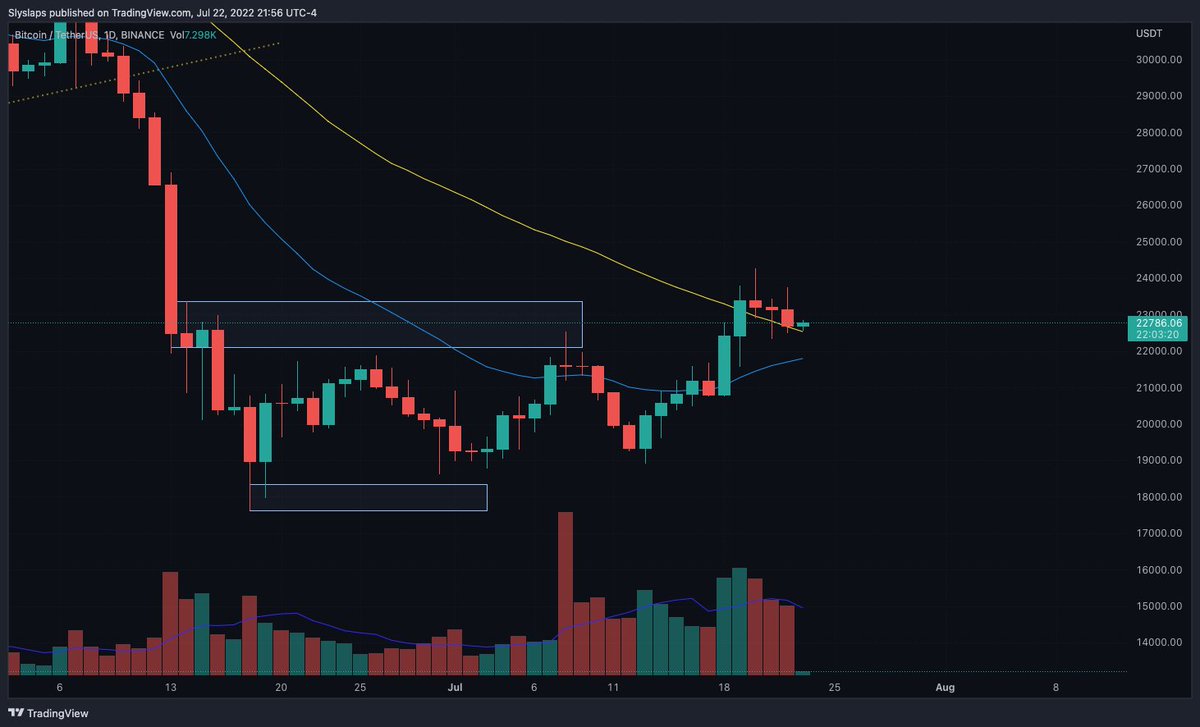
- looking at the two white zones at the bottom:
- If this weekly candle closes under this current level (~ 19.5k to 17.5k) then we probably drop to the next major level of liquidity (supply) which is ~ 10k to 12k
- just relax, watch price action, and mark out zones
$BTC | #BTC
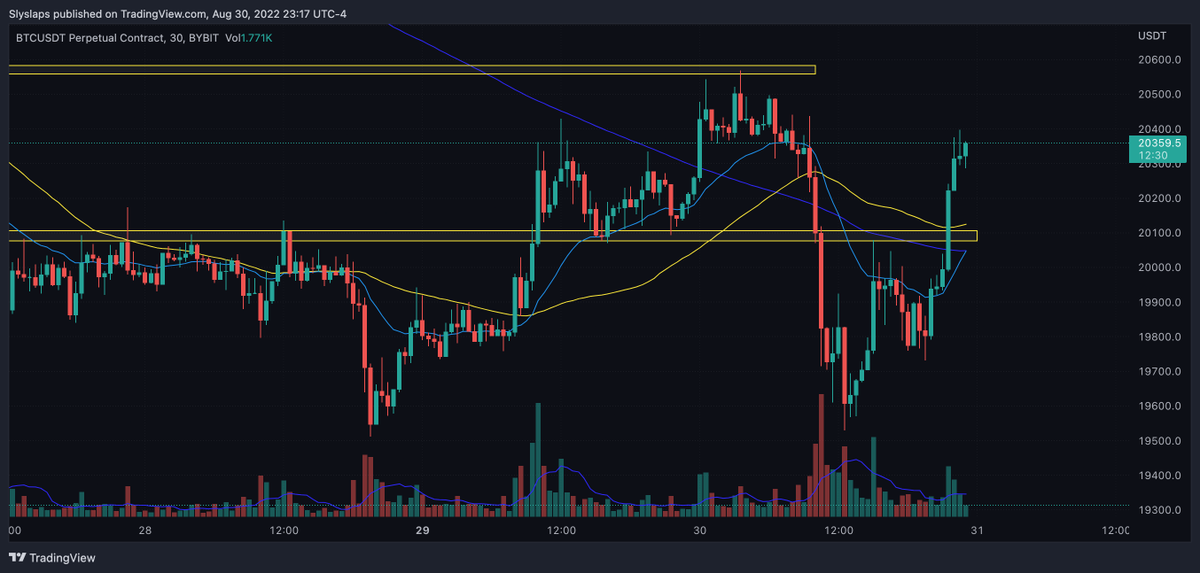
- some zones to look at
- using moving averages & s/r zones together as confluences is valid imo
- "For identifying significant, long-term support and resistance levels & overall trends, the 50, 100 and 200-day moving averages are the most common" (⬇️⬇️ for citation)
$BTC | #BTC
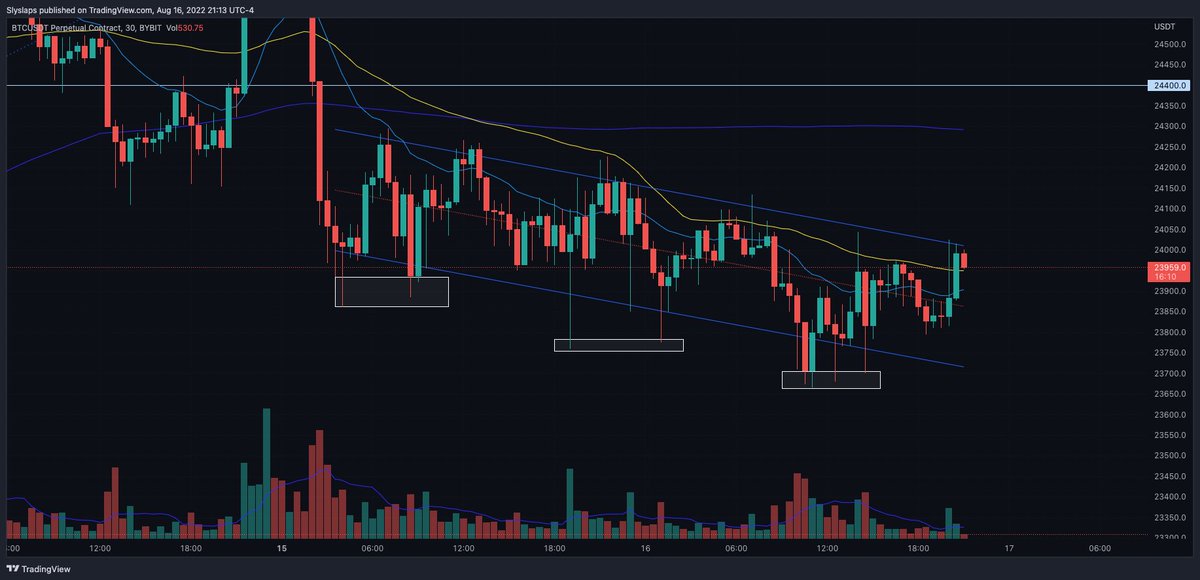
- descending channel with support and resistance being 2 deviations from the center
- price testing the upper level
- bullish volume is relatively strong compared to bear. going to need this current candle to close strong and red to stay within this channel
$BTC | #BTC
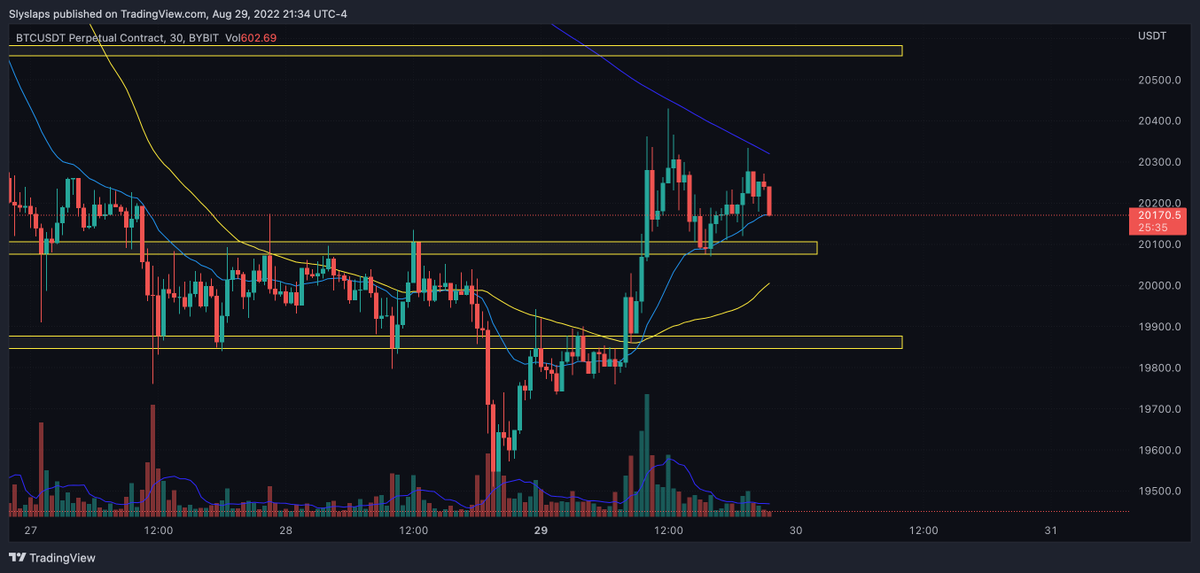
- price broke and closed above the high on Jul 18-19
- price looks to be flagging after this breakout with decreasing bearish volume
- waiting at least for this daily candle to close
- be patient with this as these candles are getting stuffed at the top