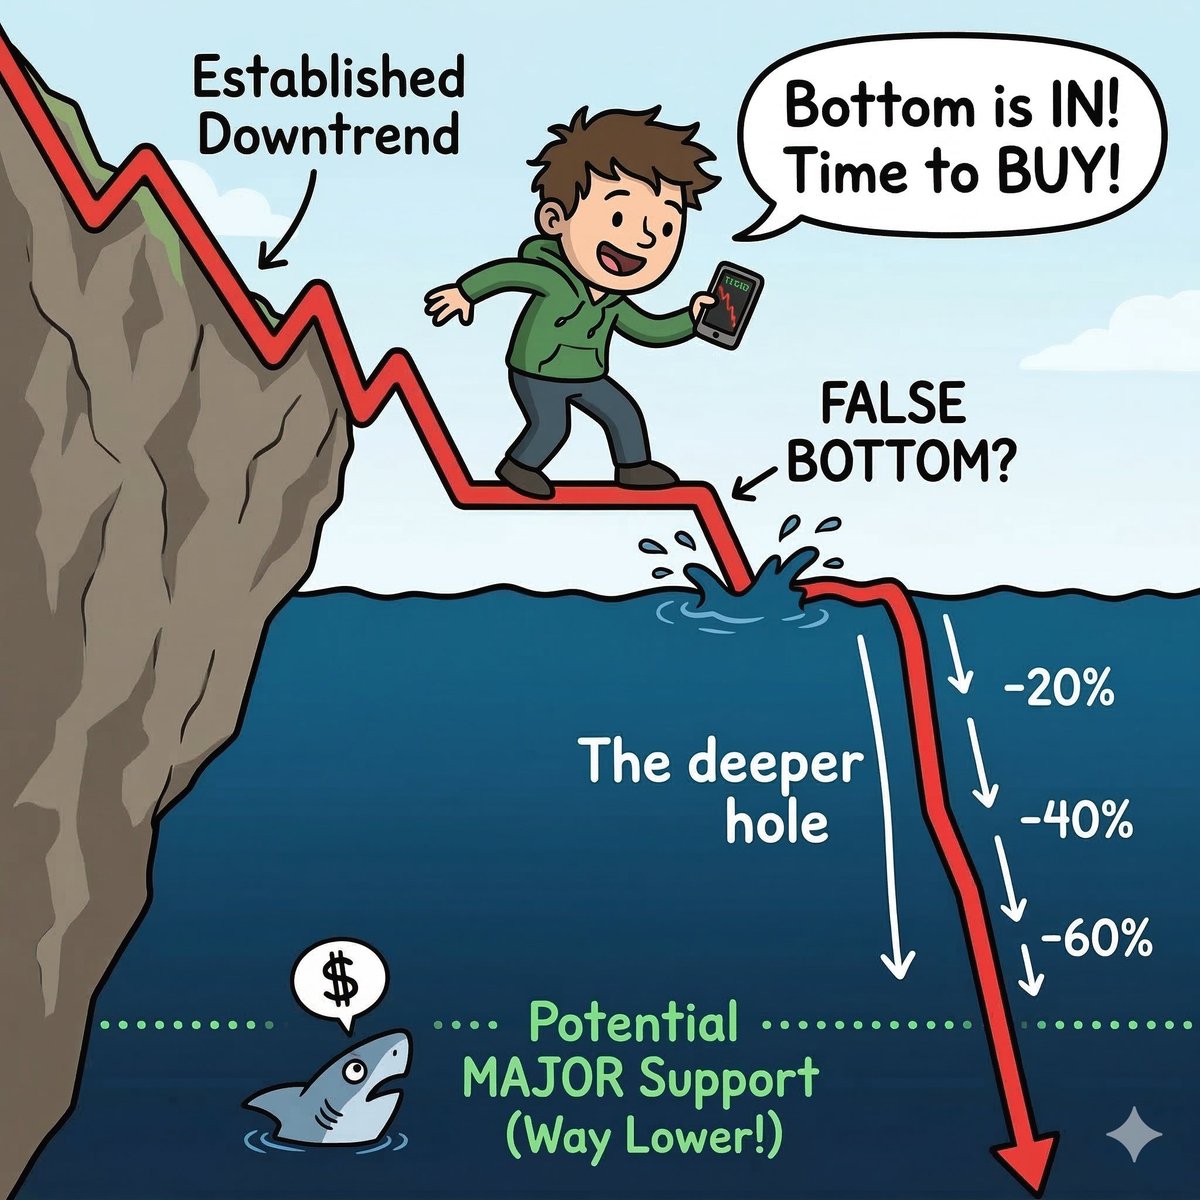
⚠️ A common mistake traders make in war-driven markets: "They try to buy value" ...
...but I think PANIC SELLING is yet to happen, if war drags on !
🔍 Stock scans today highlight oversold position, but monthly and quarterly supports are yet to play out. Best to avoid sectors with gulf exposure, such as
🏗️ Construction EPC names.
🛢️ Oilfield services.
⚙️ Engineering exporters.
📈 Price rebounds look attractive, but the professionals position tells a different story. Shorts are still high across most stocks !
🛡️ Risk management is boring : But REEMBER that boring keeps capital alive.
💭 “Market bottom ka excitement sabko hota hai…
par bottom usually boring phase mein banta hai.”
⚓ Unless war stopes, then sector breadth improves above 65% atleast, rallies remain in distribution phases and it seems like a SELL on RALLY market !
#stoxsense #nse #nifty #nifty50 #bse #learntradingwithsudhir #sebiregistered
Implied volatility (IV) is a key factor for choosing an options strategy because it affects options prices the MOST, and helps traders determine if an option is relatively cheap or expensive to BUY or SELL.
A short summary below on correct strategy to deploy under different IV conditions.
#learntradingwithsudhir #SEBI #SEBIREGISTERED #ImpliedVolatility #Volatility #OptionsTrading #optionbuying #Optionselling
TCS: Short-Term Pain, Long-Term Play? 🧐
🔻 Q1 Results Disappoint : Markets didn’t like what they saw. Weak performance = weak sentiment.
📉 Downside Watch:
💥 ₹3000 – ₹2900 is in sight.
This zone may act as strong support and a base for consolidation through the next quarter.
🔼 Upside Resistance:
📈 ₹3500 – ₹3700 is a tough wall to crack.
A breakout here will need a serious positive trigger — not happening without some fireworks.
🧮 Valuation Comfort?
✅ Current P/E: ~24
📊 5-Year Avg: 31
That’s a discount worth noting.
💬 Management Commentary?
Not great — but not terrible.
(Thanks to already low expectations.)
📦 Conclusion:
🚀 Long-term investors:
⏳ Consider accumulating on dips near ₹2900–₹3000.
📈 Patience will be key.
#TCS #StockMarket #Nifty50 #ITStocks #learntradingwithsudhir
A major bounce in the IndusInd stock was triggered after a top brokerage firm gave it a thumbs up with a higher price target. 📈
🔻 Downside:
700–680 zone is rock-solid support. Unless there’s a major shock, it’s unlikely to go below that.
Nearest support now sits at 750–760.
🔺 Upside Potential:
Strong resistance seen at 910–940, with a breakout possibly taking it to the 1000+ zone.
💡 Risk Factor:
The real risk here lies in future growth and profitability, after the stock already took a hit from one-time losses.
A fresh cash infusion by promoters could be a game-changer and boost investor confidence.
📊 Valuation Check:
Current valuations look very attractive. The 750–800 range might be a smart entry zone for long-term investors.
✅ Bottom Line:
This looks like a potential reversal story in the making. Keep an eye on 750–800 — it could be your golden zone for long-term gains! 🌟
#StockMarket #Investing #IndusindBank #ValueBuy #StockAnalysis #technicalanalysis #learntradingwithsudhir
🚨ONGC share prices on the Move: What’s Driving it ?
The recent surge in ONGC stock is fueled by a sharp spike in crude oil prices and rising geopolitical tensions. But how long can the rally last?
🔻 Support Alert: The ₹235–₹230 zone is acting as a rock-solid support. ONGC is also trading above all key moving averages on both daily and weekly charts—a bullish sign!
🔺 Resistance Zone: Watch the ₹270–₹275 range closely. It’s a major resistance, and any cooling off in crude prices could trigger downside pressure.
⚠️ The Real Risk? It’s not ONGC itself—it’s crude oil. With a potential global recession looming by late 2025, markets are already pricing in lower crude through mid-2026.
📉 What’s Next? Expect ONGC to remain rangebound over the next few quarters as it navigates this volatile energy cycle.
#ONGC #StockMarket #CrudeOil #TechnicalAnalysis #Investing #NiftyEnergy #StockAlert #learntradingwithsudhir
🚀 Suzlon Energy Share prices jumped after solid Q results + bullish outlook from mgmt.
🔻 Support: 51–56 zone (just under weekly EMA) — strong base unless something seriously breaks.
🔺 Resistance: 81–86 — likely target before the next pause.
📊 P/E ~ sector avg (45), but P/BV is a steep 15.8 — priced for perfection.
📈 High-risk, high-conviction bet. Adding near support = smart play.
#investing #indianstockmarket #NSE #BSE #Suzlon #suzlonenergy #technicalanalysis #learntradingwithsudhir
DLF Ltd – Strong Results, Stronger Momentum! 📈
✅ Earnings Update: DLF posted solid results yesterday with positive management commentary, boosting investor confidence.
📊 Technical View:
- Stock is bouncing from 200-week EMA, a key long-term support. Immediate support zone: ₹690–710
- Below that, ₹660–630 gap area could cushion deeper corrections
🚀 Bullish Signals: Broke above 200-day EMA today – confirms trend reversal
Key resistance zones ahead:
🔹 ₹800 as nearest major hurdle
🔹 Thereafter, ₹820–850 and then ₹860–900
💰 Valuation Check:
Currently trading at P/BV ~4.4 (vs 5-yr avg of ~2.7)
Valuation looks stretched, but improving fundamentals could sustain the premium
📌 Bottom Line: Adding on dips near support zones could be a smart long-term play.
#DLF #StockMarketIndia #TechnicalAnalysis #Fundamentals #NiftyRealty #learntradingwithsudhir
JSW Energy's latest results were decent and matched expectations.
🔻 Strong support at ₹430 (200W EMA)
🔺 Resistance at ₹530 (short term) & ₹550–575 (major breakout zone)
📉 JSW Energy is trading at P/BV ~3.1 (5-yr avg = 3.1), P/E ~44 (5-yr avg = 40.5).
⚠️ High debt due to capex is weighing on ROE.
🎯 Good Strategy: Owning near ₹430-450 support for long-term, OR Wait for breakout above ₹575 for momentum play.
#Stocks #Investing #Indianstockmarket #learntradingwithsudhir #jswenergy #Technicalanalysis
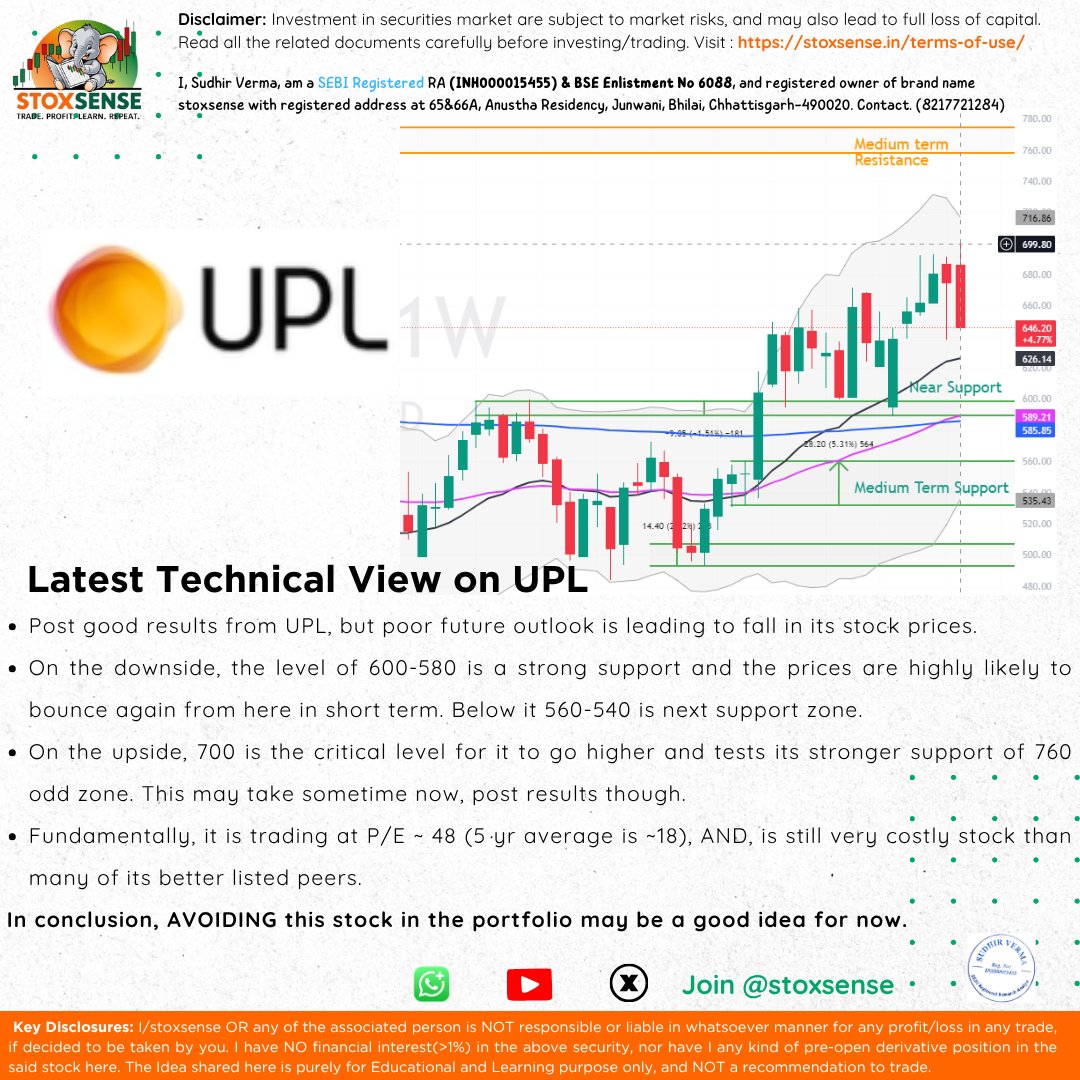
#UPL posted strong results, but weak future outlook is dragging the stock prices down.
📉 Support: ₹600–580 (likely bounce zone), then ₹560–540
📈 Resistance: ₹700, then ₹760 (long shot for now)
⚠️ Valuation: P/E ~48 vs 5Y avg ~18
👉 Still overpriced. Best to AVOID for now
#learntrading #rsi #technicalanalysis #StockMarketIndia #StockMarket #upl
@zaff1262 Logically, such low PEG of 0.31 will mean growth rate of > 50% at current P/E (not the case). Check out screener or tickertape- more reliable information.
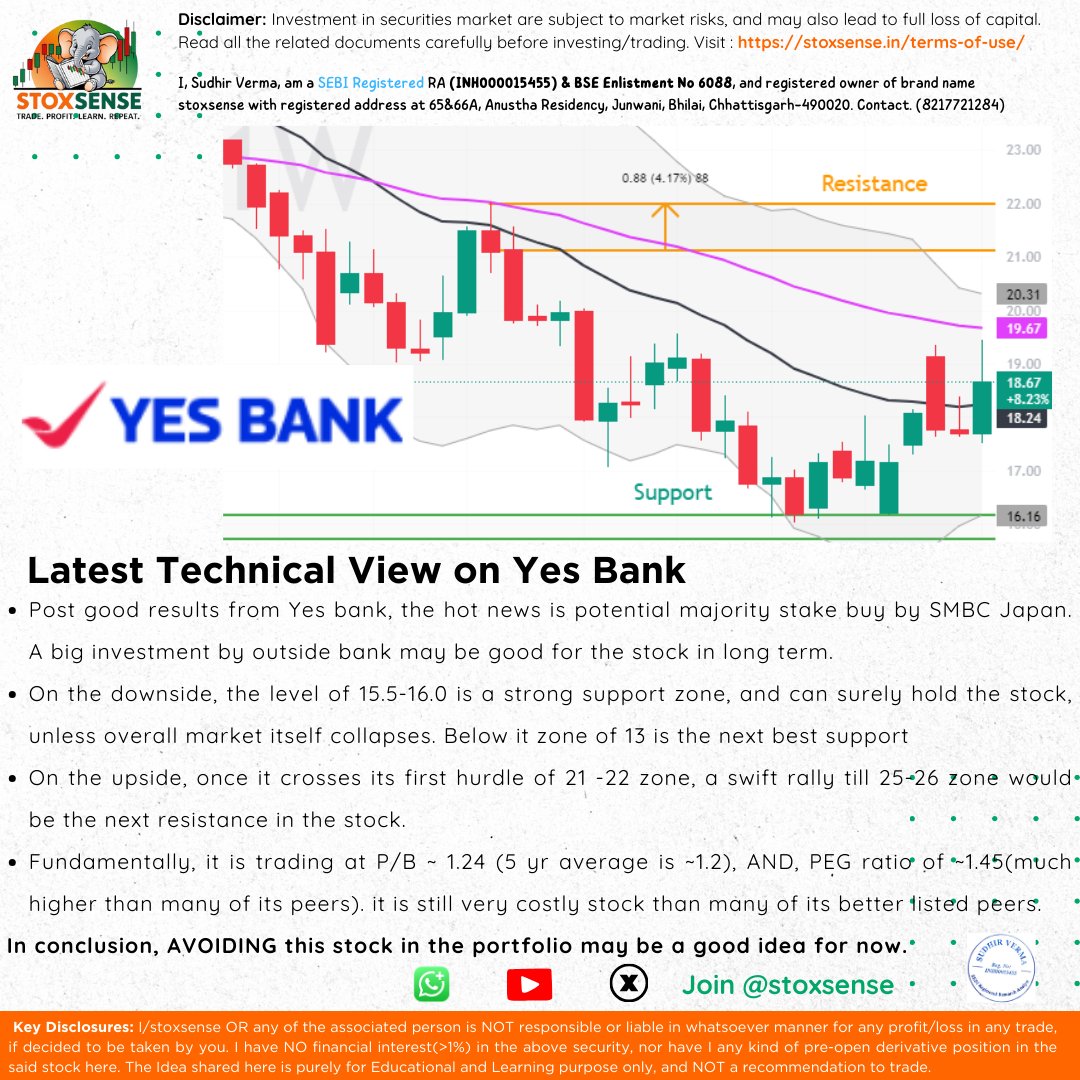
Post good Q4 results, #Yesbank is Buzzing on Rumors of SMBC Japan eyeing majority stake 👀
Big foreign investment = 🔥 long-term sentiment booster
But Technically...
📉 Strong support: ₹15.5–16
⚠️ If that breaks, next support: ₹13
📈 Resistance ahead: ₹21–22
Clear that = rally to ₹25–26 possible
But here's the catch:
📊 P/B ~1.24 (above 5-yr avg ~1.2)
📈 PEG ~1.45 — higher than many peers
👉 Still looks expensive
⚠️ Despite the hype, might be wise to AVOID for now.
#StockMarket #YesBank #Investing #leartradingwithsudhir #nseindia #bse
#bseindia shares on 🔥!
Posted blockbuster earnings yesterday — outshining even NSE! 📈
Stock’s flying high with no resistance in sight,but wait..
💡 Fundamentally? Looks pricey vs NSE & global peers
⚡ Valuation driven by growth hype
🧱 Key support zones:
• ₹6000–6100 (short-term)
• ₹5450–5600 (next level)
• ₹4400–4600 (long-term)
📉 Already rallied big pre-results — upside may be capped
🔍 Smart move? WAIT for a dip before buying in!
#BSE #StockMarketIndia #Trading #Nifty #InvestingTips #StocksToWatch #learntradingwithsudhir