📊 ES (S&P 500 E-mini Futures) Levels Recap — Apr 09
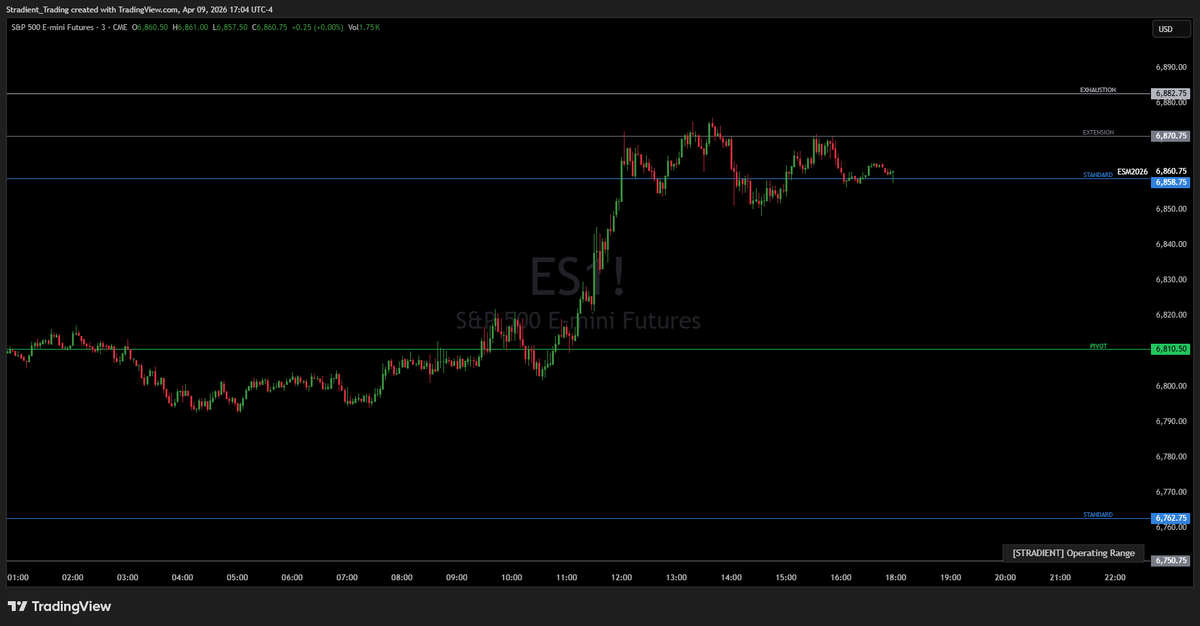
Flat, directionless price action for the first 8 hours, consolidating just above Pivot (6,810.50) with no conviction in either direction.
Around 09:00, explosive breakout off Pivot, clean vertical move, no hesitation. Pivot flipped from resistance to launchpad in one candle.
Standard (6,858.75) hit and accepted on the first push, price held above it briefly before Extension (6,870.75) got tagged near the highs around 11:00–12:00.
Rejection off Extension, pullback into Standard (6,858.75) which now acts as the pivot of the afternoon range. Price coiling just above it into close, unable to reclaim Extension cleanly.
Exhaustion (6,882.75) never tested, Extension capped the move. Lower Standard (6,762.75) untouched all session.
📊 ES (S&P 500 Futures) Quant Levels — April 9
6,810.50 is the Pivot today. Above it, buyers control.
Below it, things get interesting.
Standard 6,858.75 / 6,762.75
Extension 6,870.75 / 6,750.75
Exhaustion 6,882.75 / 6,739.00
Extreme 6,907.00 / 6,715.25
Tail 1 at 6,931.50 / 6,691.75
Tail 2 at 6,953.75 / 6,670.25
Fat Tail 1 at 7,018.00 / 6,609.25
Fat Tail 2 at 7,179.50 / 6,460.50
Save it to your charts for today.
📊 ES (S&P 500 Futures) Quant Levels — April 9
6,810.50 is the Pivot today. Above it, buyers control.
Below it, things get interesting.
Standard 6,858.75 / 6,762.75
Extension 6,870.75 / 6,750.75
Exhaustion 6,882.75 / 6,739.00
Extreme 6,907.00 / 6,715.25
Tail 1 at 6,931.50 / 6,691.75
Tail 2 at 6,953.75 / 6,670.25
Fat Tail 1 at 7,018.00 / 6,609.25
Fat Tail 2 at 7,179.50 / 6,460.50
Save it to your charts for today.
📊CL (Crude Oil Futures) Levels Recap — Apr 08
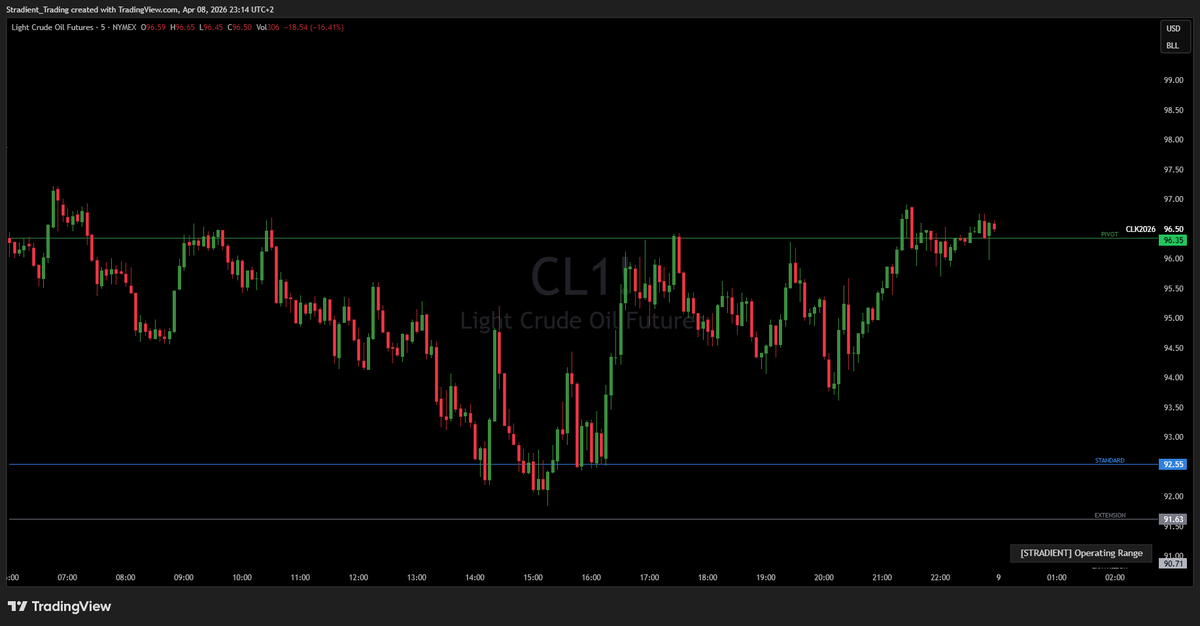
Pivot (96.35) acted as the gravitational center all session, price oscillating around it throughout the European and early US hours with no clean directional conviction.
Multiple tests of Pivot from both sides, neither bulls nor bears able to establish a sustained hold, classic chop around a key level.
Aggressive sell-off mid-session drove price all the way down to Standard (92.55), tagging it precisely around 12:00–15:00 before finding a floor.
Standard held cleanly, price bounced hard off it, confirming the level as the day's structural low.
Recovery into the close brought price back up to Pivot, closing at 96.50, right on top of it heading into tomorrow.
#oil #trading
📊 CL (Crude Oil Futures) Quant Levels — April 8
96.35 is the Pivot today. Above it, buyers control.
Below it, things get interesting.
Standard 100.30 / 92.55
Extension 101.31 / 91.63
Exhaustion 102.34 / 90.71
Extreme 104.41 / 88.91
Tail 1 at 106.53 / 87.14
Tail 2 at 108.50 / 85.56
Fat Tail 1 at 114.34 / 81.19
Fat Tail 2 at 130.19 / 71.30
Save it to your charts for today.
📊 CL (Crude Oil Futures) Quant Levels — April 8
96.35 is the Pivot today. Above it, buyers control.
Below it, things get interesting.
Standard 100.30 / 92.55
Extension 101.31 / 91.63
Exhaustion 102.34 / 90.71
Extreme 104.41 / 88.91
Tail 1 at 106.53 / 87.14
Tail 2 at 108.50 / 85.56
Fat Tail 1 at 114.34 / 81.19
Fat Tail 2 at 130.19 / 71.30
Save it to your charts for today.
📊GC (Gold Futures) Levels Recap — Apr 07
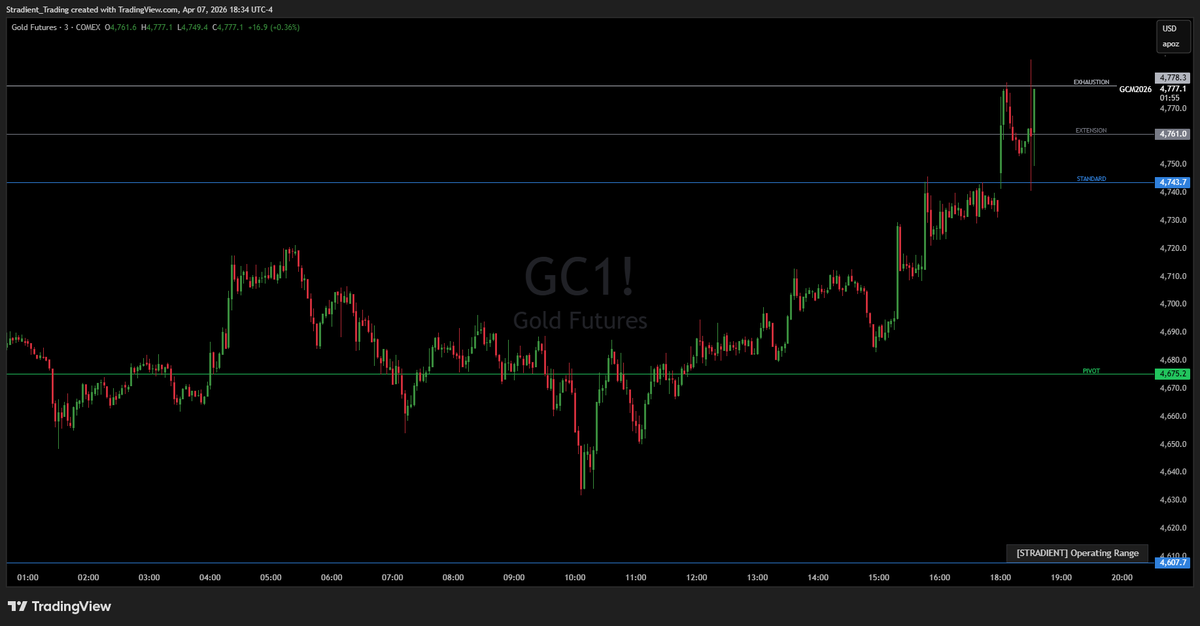
Choppy session below Pivot (4,675.2) for the first 14 hours, price unable to reclaim it cleanly, multiple failed attempts capping upside.
Around 15:00, clean break and hold above Pivot, confirming the level as support.
Standard (4,743.7) taken out aggressively into the NY afternoon close, no pause, straight through.
Extension (4,761.0) offered zero resistance, price sliced it and pushed directly into Exhaustion (4,778.3).
Sharp rejection off Exhaustion into the close, back to 4,777, level did its job.
📊 GC (Gold Futures) Quant Levels — April 7
4,675.2 is the Pivot today. Above it, buyers control.
Below it, things get interesting.
Standard 4,743.7 / 4,607.7
Extension 4,761.0 / 4,591.0
Exhaustion 4,778.3 / 4,574.3
Extreme 4,813.2 / 4,541.2
Tail 1 at 4,848.3 / 4,508.3
Tail 2 at 4,880.5 / 4,478.6
Fat Tail 1 at 4,974.0 / 4,394.4
Fat Tail 2 at 5,213.1 / 4,192.8
Save it to your charts for today.
98% win rate. No sample size, no RR, no drawdown, no out-of-sample. Just boxes on a chart.
This is how you spot retail content: the result is the headline, the methodology doesn't exist.
ICT "institutional" concepts, order blocks, FVGs, buyside liquidity, institutions don't leave repeatable price patterns for retail traders to front-run on a 5-min chart. Real institutional flow goes through dark pools, algos, and options markets. It doesn't print a pretty box at 9:45 AM.
A 98% win rate with no context is just a wide stop and a garbage RR dressed up as a strategy.
353 retweets. 3.2k bookmarks. People are really saving this. 😂
Right on profile shapes. But that's still a retail debate.
No institutional desk uses Volume Profile, with or without the nuances. VAH, VAL, POC, profile shapes, none of it is in the toolkit.
It's a historical record of where volume printed. Liquidity isn't volume.
Where liquidity actually shows up: dealer gamma exposure, dark pool prints, options open interest by strike. That's what moves price.
📊 GC (Gold Futures) Quant Levels — April 7
4,675.2 is the Pivot today. Above it, buyers control.
Below it, things get interesting.
Standard 4,743.7 / 4,607.7
Extension 4,761.0 / 4,591.0
Exhaustion 4,778.3 / 4,574.3
Extreme 4,813.2 / 4,541.2
Tail 1 at 4,848.3 / 4,508.3
Tail 2 at 4,880.5 / 4,478.6
Fat Tail 1 at 4,974.0 / 4,394.4
Fat Tail 2 at 5,213.1 / 4,192.8
Save it to your charts for today.
📊 NQ (Nasdaq 100 Futures) Levels Recap — April 6
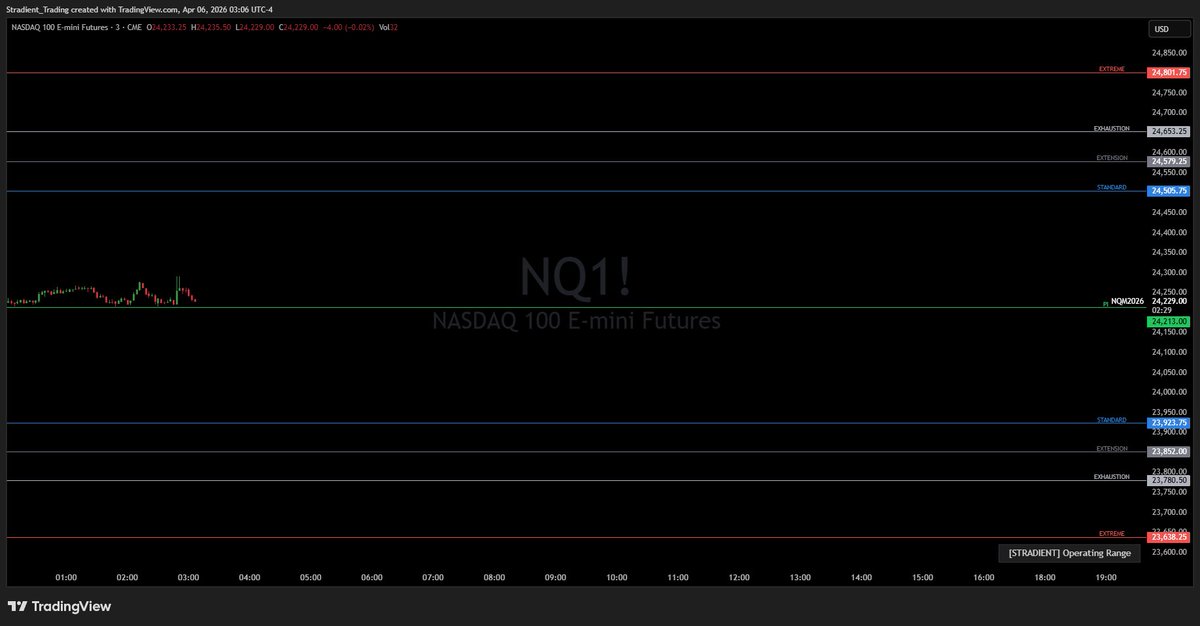
Two clean Pivot (24,213) rejections defined the session.
First test between 02:00–04:00, price wicked down to the level and bounced immediately, no follow-through below.
Grind higher into the NY open, spike to 24,460 around 10:00, then a full round trip back to Pivot by 13:15.
Second touch, same reaction, buyers stepped in right at 24,213, sharp bounce.
Closed at 24,342, Pivot held as the floor all session. 🟢
📊 NQ (Nasdaq 100 Futures) Quant Levels — April 6
24,213 is the Pivot today. Above it, buyers control.
Below it, things get interesting.
Standard 24,505.75 / 23,923.75
Extension 24,579.25 / 23,852.00
Exhaustion 24,653.25 / 23,780.50
Extreme 24,801.75 / 23,638.25
Tail 1 at 24,951.25 / 23,496.50
Tail 2 at 25,088.00 / 23,368.50
Fat Tail 1 at 25,484.50 / 23,005.00
Fat Tail 2 at 26,492.75 / 22,129.50
Save it to your charts for today.
📊 NQ (Nasdaq 100 Futures) Quant Levels — April 6
24,213 is the Pivot today. Above it, buyers control.
Below it, things get interesting.
Standard 24,505.75 / 23,923.75
Extension 24,579.25 / 23,852.00
Exhaustion 24,653.25 / 23,780.50
Extreme 24,801.75 / 23,638.25
Tail 1 at 24,951.25 / 23,496.50
Tail 2 at 25,088.00 / 23,368.50
Fat Tail 1 at 25,484.50 / 23,005.00
Fat Tail 2 at 26,492.75 / 22,129.50
Save it to your charts for today.
Everyone is watching Saudi reroute oil through Yanbu to bypass Hormuz.
Nobody is talking about who else is using that corridor.
According to Goldman Sachs / Kpler data, the biggest exporter through Bab-el-Mandeb in March 2026 is Russia at 2.6mb/d. Saudi is second at 2.5mb/d.
And where does it go? India gets 2.2mb/d. China gets 1.3mb/d.
The corridor the West is relying on to offset Hormuz is being shared with Russian oil flowing directly to India and China.
Saudi Arabia just doubled crude exports from Yanbu to ~5mb/d in two weeks. The East-West pipeline is now at full capacity at ~7mb/d.
Yanbu is offsetting ~45% of lost Persian Gulf shipments. 55% is still gone. And the pipeline is already maxed out.
Saudi is moving as fast as physically possible to route around Hormuz. Doing it this aggressively tells you they don't expect the strait to reopen anytime soon.
There's no more room to compensate from here.
Tungsten hit $3,000/mtu this week.
14 months ago it was $320.
Here's why this one is different from every previous tungsten rally:
China controls ~80% of global supply. In early 2025 they implemented export controls that effectively killed Western access overnight. No substitute exists. Recycling can't scale. New mines take years to build.
On the demand side, every tungsten penetrator fired at 1,700 m/s fragments into foreign soil and disappears from the supply chain permanently. This isn't machine tool scrap that gets recycled. NATO is scaling to millions of shells per year.
"The current conflict in the Middle East is a contributing factor to the most recent price surge." Janine Le Roux, Project Blue
The kicker: NDAA bans Chinese tungsten from US defense contracts starting January 1, 2027. Western producers have a two-year window before that demand is legally locked out of China.
The only non-Chinese pure plays with active production today: $ALM (Almonty, Nasdaq) and $EQR.AX (EQ Resources, ASX).
@onlybreakouts "Used this in our fund across thousands of strategies."
Man, if your fund is running ATR(20) breakouts on 30min ES you don't have a fund.
You have a YouTube channel with a disclaimer.
@options_matrix@tradertheory Man your reply was generated by ChatGPT.
I can tell. Everyone can tell.
Maybe let a human run the account if you're in the edge business.
@SoulzBTC "Identifying liquidity" with candles is like diagnosing a car crash by looking at the dent.😂
The actual liquidity is upstream, GEX, Vanna, Charm. By the time it's on your chart, it already happened.
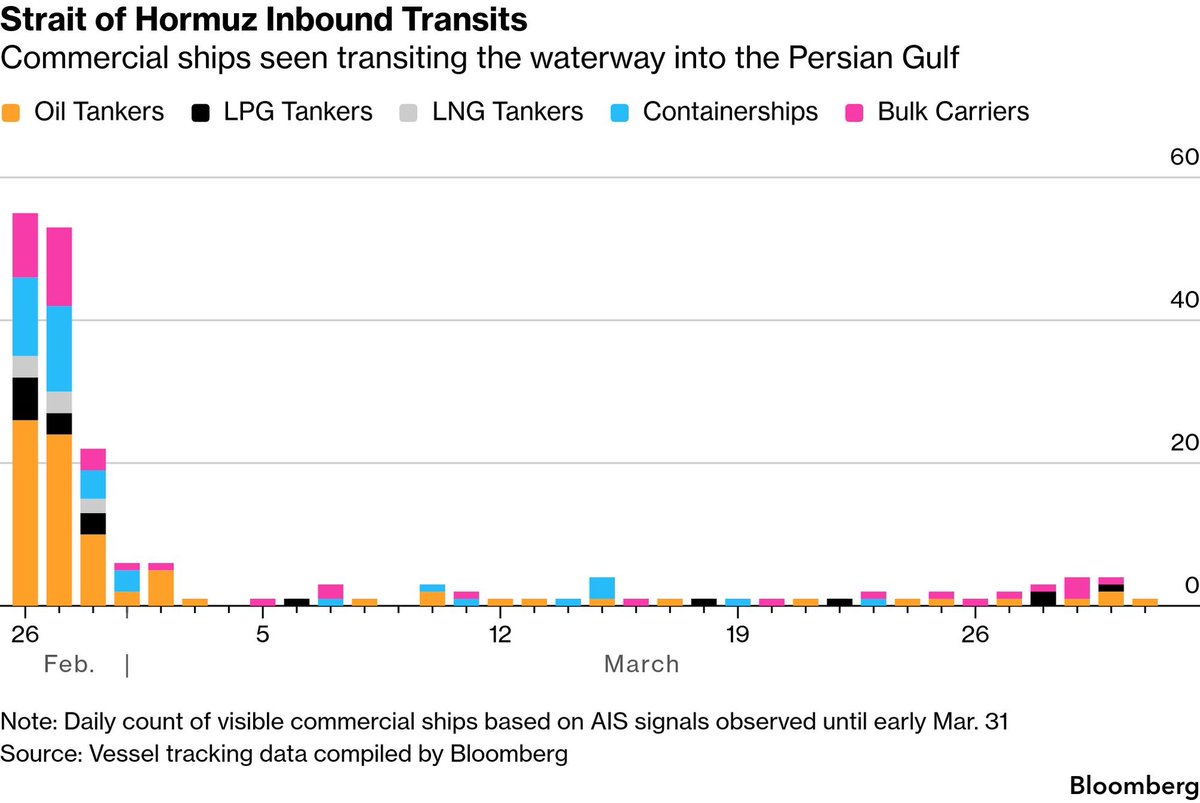
Hormuz is functionally closed.
Not 'disrupted'. Not 'reduced'. Closed.
Feb 26: ~50 inbound transits/day across all vessel types. Post Feb 27: flatline. Oil tankers, LNG, containerships, bulk carriers, all of them.
Trump's ceasefire condition: Strait must be 'open, free and clear' first. Current throughput: 94% down.
Brent +42% MTD. And the market still hasn't fully priced a prolonged closure.
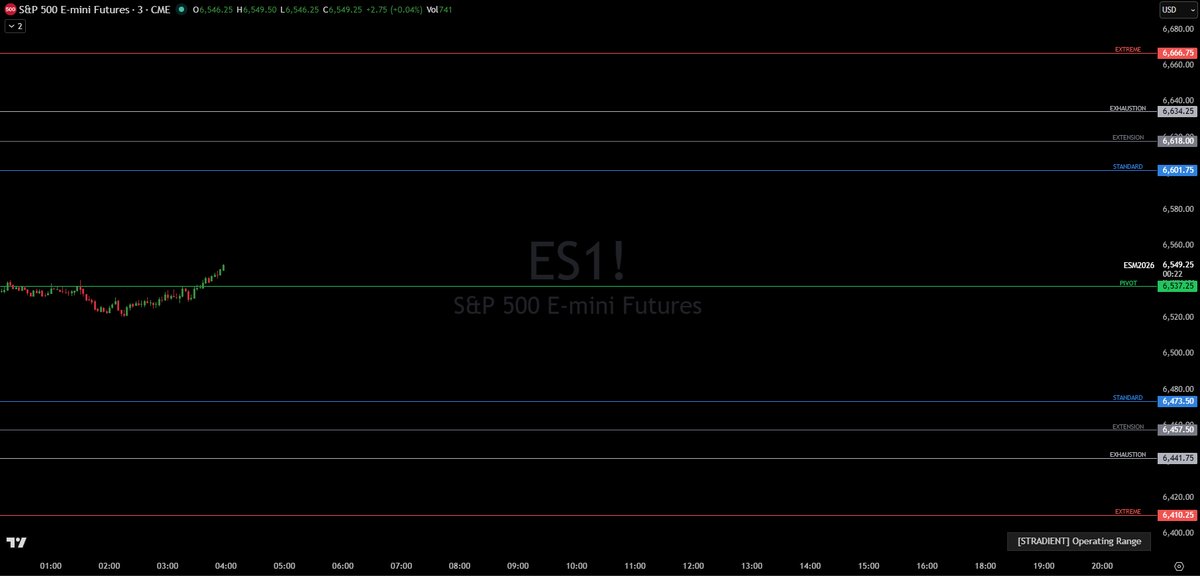
📊 ES (S&P 500 Futures) Quant Levels — April 2
6,537.25 is the Pivot today. Above it, buyers control.
Below it, things get interesting.
Standard 6,601.75 / 6,473.50
Extension 6,618.00 / 6,457.50
Exhaustion 6,634.25 / 6,441.75
Extreme 6,666.75 / 6,410.25
Tail 1 at 6,699.50 / 6,379.00
Tail 2 at 6,729.50 / 6,350.50
Fat Tail 1 at 6,816.25 / 6,269.75
Fat Tail 2 at 7,035.50 / 6,074.25
Save it to your charts for today.
SPX +3%. Everyone's celebrating.
Look under the hood.
SPY put premium: $3.16B vs $1.55B in calls.
P/C ratios: SPY 1.71, QQQ 1.40, IWM 1.90.
Institutions aren't buying the rally.
They're hedging it.
The hedge isn't on today.
It's on what comes next.
The affordability data is real. The volume collapse is real.
But 2008 was a credit event. Subprime defaults, synthetic CDOs, systemic leverage.
This is a lock-in effect. Sellers won't move because they're sitting on 3% mortgages.
Frozen market and broken market are not the same thing.