Formerly Better Trader Academy. The home of "Mr Breakouts". Algo Breakout Trading Specialists. Follow for tips and strategies on algorithmic breakout trading.
One condition. No indicator. No parameter to optimize. It filtered 80% of bad trades from a NASDAQ breakout strategy.
The condition: is the high of the entry bar above today's open?
That's it. One line of code.
If yes, the market has been trading above today's open. There's an established uptrend for the day. Enter the long breakout.
If no, the market is below today's open when your signal fires. You're not in an uptrend. You're trading noise. Skip.
Before:
- Net profit/drawdown ratio: 5.24
- Drawdown: ~$40,000
- Average trade: $120
After:
- Net profit/drawdown ratio: 7.97
- Drawdown: ~$25,000
- Average trade: $162
Net profit went up while drawdown got cut. That's the signature of a genuine filter. It's removing the right trades, not random ones.
Why does it work? Breakout trading is about momentum. If you're buying a breakout to the upside but the market has been trading below its open all day, there's a contradiction. The price level is breaking out, but the day's direction says otherwise. Those trades are the ones that chop you up.
No parameters means no overfitting. This is pure trading logic. You could test it on any long breakout strategy, on any market, in minutes.
The power isn't in complexity. It's in asking the right question.
What's the simplest filter you've ever used?
Bookmark this. Next time someone tells you to add RSI to your breakout strategy, you will have 4,115 reasons to push back.
Full study with methodology and equity curves: https://t.co/8DzeoyjVQO
I tested 100 indicator conditions across 4,115 breakout strategies on NASDAQ and Bitcoin.
The results completely contradict what most trading courses teach.
RSI and stochastic oscillators are among the most popular indicators on the planet.
They ranked dead last.
Not just underperformed. They actively made strategies worse.
> On NASDAQ (3,500 strategies): oscillators produced negative uplift in-sample.
> On Bitcoin (615 strategies): oscillators finished last in both in-sample and out-of-sample testing.
Meanwhile, the single best-performing indicator across the entire study was one of the oldest tools in technical analysis.
Bar range relative to ATR.
High minus low compared to average true range. That is it.
When applied as a filter across those 3,500 NASDAQ strategies:
> Net profit improved by 60%.
> Max drawdown decreased by 40%.
> Win percentage improved.
> Average trade improved.
> Highest robustness index of any filter tested.
Robustness is the key word. It means the improvement you see in-sample correlates with improvement on data the strategy has never touched. The edge is real. It carries forward.
Why does ATR work when RSI fails?
Oscillators measure overbought and oversold conditions. They were designed for mean-reverting, range-bound environments. Breakout trading is the opposite. You need directional moves pushing beyond established ranges.
An oscillator reading "overbought" during a genuine breakout tells you to skip the exact move you should be taking. It is structurally mismatched to the task.
ATR measures something more fundamental: is this bar expanding or contracting relative to recent history? Is there real momentum behind this move?
That question has an answer. RSI does not.
Second place on NASDAQ: Money Flow Index (MFI). It combines price direction and volume into a single indicator.
Specific setup:
> MFI period: 14
> Smoothing: 30-period moving average of the MFI itself
> Signal: calculate the percentage difference between raw MFI and its MA
> If percentage difference is above your threshold, conditions favor a long entry
Out-of-sample results on NASDAQ with this filter:
> Net profit improved.
> Max drawdown improved by 32%.
> Average trade improved.
> Win percentage improved.
Every metric simultaneously. That is extremely rare.
For Bitcoin, the picture shifted. Volume indicators that dominated on NASDAQ flopped out-of-sample on crypto. Reason: crypto volume data is distorted by wash trading and exchange fragmentation.
On Bitcoin, volatility indicators took over. Standard deviation of close vs its moving average improved average trade by 54% and win rate by 11%.
The cross-market universal findings:
> Volatility indicators (ATR, standard deviation, true range) work everywhere.
> Oscillators fail everywhere.
> Volume works on markets with clean data. Crypto is not one of them.
The AI irony: Gemini generated all 100 indicator conditions used in this study.
The best-performing output was the simplest thing it produced.
High minus low. A decades-old concept. Still the best filter across 4,115 strategies.
100 indicators. 4,115 strategies. The ranking is not even close.
Every breakout strategy I've ever built follows four simple steps. Same structure. Every time.
Step 1: Pick a Point of Initiation
Step 2: Calculate the Space (entry distance)
Step 3: Define the Time (when to trade)
Step 4: Add Filters (when NOT to trade)
Here's how each one works.
Step 1, Point of Initiation. Where you measure the breakout from. Could be today's open, yesterday's close, a moving average, or the high/low of a specific period. It anchors everything.
Step 2, Space. How far does price need to travel from the initiation point before it qualifies as a real breakout? ATR period 20, multiplied by a fraction (1.5 to 3.0 depending on the market). This gives you a dynamic entry level that adapts to current volatility.
Step 3, Time. Not every hour is equal. Breakouts at the US market open behave differently than breakouts at 2pm. For day trading, you might exit on close. For swing trading, you hold overnight.
Step 4, Filters. This is where you get selective. Is the daily trend supporting your direction? Is volatility high enough for follow-through? Does the bar before entry confirm momentum?
Start with Steps 1 and 2 only. Build the simplest possible version. Test it. If the core behavior is real, if price breaking ATR-based levels produces genuine follow-through, then add Steps 3 and 4 to refine it.
If the core doesn't work, no amount of filtering will save it.
That's the beauty of this structure: you find out fast whether you have an edge or not.
Four steps. No guesswork about what to test next.
You spend weeks building a strategy on TradingView or MetaTrader 5.
The backtest looks exactly how you want it.
Consistent equity curve.
Reasonable drawdown.
You feel good about it.
You go live.
And within a few weeks, it falls apart.
You go back to the drawing board.
Optimize again.
Tweak the parameters.
The backtest looks good again.
You try again.
Same result.
This is one of the most common experiences in retail algorithmic trading.
And most traders spend months cycling through it before they figure out why it keeps happening.
It is not the strategy.
It is the validation step that was never done.
Here is what both platforms are missing.
The first gap: no in-sample/out-of-sample testing.
The way it should work is simple.
You build and optimize your strategy on one portion of your historical data.
You reserve a clean, untouched portion that your strategy never saw during development.
Then you test it there.
If the strategy holds on data it was never trained on, you have something real.
If it collapses, you saved yourself real money.
Neither TradingView nor MetaTrader 5 supports this natively.
There are workarounds.
But a workaround is not a workflow, and it does not scale.
The second gap: no walk-forward analysis.
This test tells you whether your strategy can survive the future, not just the past.
Walk-forward analysis runs your strategy across multiple different unseen data windows and checks whether it holds up consistently.
It also tells you whether your strategy handles regular re-optimization well as market conditions change over time.
Every profitable algorithmic trader I know runs this before touching a live account.
Both platforms skip it entirely.
The fix is to build your validation layer separately, then deploy the code.
My workflow: build foundational breakout models in BreakoutOS, run full in-sample/out-of-sample validation and walk-forward testing, then export the PineScript or MQL5 code directly into TradingView or MetaTrader.
Here is what that looks like.
I used 10 years of E-mini NASDAQ data.
Last 3 years reserved as unseen validation data, never touched during development.
The foundational model tested:
> ATR periods: 5, 20, and 40
> Space multiplier: 2.0
> No filters - raw edge only
ATR multiplier 2.0 ranked number one across all walk-forward periods.
Robustness index: 66%.
Recency alignment with the most recent data: strong.
That model is ready to deploy.
Not because the backtest looked good.
Because it survived tests it was never designed for.
Most traders have a dream income in mind… but almost none know what it actually takes to reach it.
This calculator breaks it down: capital required, expected returns, compounding path, timeframe - everything.
Run your plan, the link’s ready in the comments ↓
If you like this, check out my FREE mini-course on how to build breakout trading strategies fast using the "Mr Breakouts Formula" (includes a free example strategy).
Get it here:
https://t.co/NLI6qxyn2f
Every breakout strategy I've ever built follows four simple steps. Same structure. Every time.
Step 1: Pick a Point of Initiation
Step 2: Calculate the Space (entry distance)
Step 3: Define the Time (when to trade)
Step 4: Add Filters (when NOT to trade)
Here's how each one works.
Step 1, Point of Initiation. Where you measure the breakout from. Could be today's open, yesterday's close, a moving average, or the high/low of a specific period. It anchors everything.
Step 2, Space. How far does price need to travel from the initiation point before it qualifies as a real breakout? ATR period 20, multiplied by a fraction (1.5 to 3.0 depending on the market). This gives you a dynamic entry level that adapts to current volatility.
Step 3, Time. Not every hour is equal. Breakouts at the US market open behave differently than breakouts at 2pm. For day trading, you might exit on close. For swing trading, you hold overnight.
Step 4, Filters. This is where you get selective. Is the daily trend supporting your direction? Is volatility high enough for follow-through? Does the bar before entry confirm momentum?
Start with Steps 1 and 2 only. Build the simplest possible version. Test it. If the core behavior is real, if price breaking ATR-based levels produces genuine follow-through, then add Steps 3 and 4 to refine it.
If the core doesn't work, no amount of filtering will save it.
That's the beauty of this structure: you find out fast whether you have an edge or not.
Four steps. No guesswork about what to test next.
You spend weeks building a strategy on TradingView or MetaTrader 5.
The backtest looks exactly how you want it.
Consistent equity curve.
Reasonable drawdown.
You feel good about it.
You go live.
And within a few weeks, it falls apart.
You go back to the drawing board.
Optimize again.
Tweak the parameters.
The backtest looks good again.
You try again.
Same result.
This is one of the most common experiences in retail algorithmic trading.
And most traders spend months cycling through it before they figure out why it keeps happening.
It is not the strategy.
It is the validation step that was never done.
Here is what both platforms are missing.
The first gap: no in-sample/out-of-sample testing.
The way it should work is simple.
You build and optimize your strategy on one portion of your historical data.
You reserve a clean, untouched portion that your strategy never saw during development.
Then you test it there.
If the strategy holds on data it was never trained on, you have something real.
If it collapses, you saved yourself real money.
Neither TradingView nor MetaTrader 5 supports this natively.
There are workarounds.
But a workaround is not a workflow, and it does not scale.
The second gap: no walk-forward analysis.
This test tells you whether your strategy can survive the future, not just the past.
Walk-forward analysis runs your strategy across multiple different unseen data windows and checks whether it holds up consistently.
It also tells you whether your strategy handles regular re-optimization well as market conditions change over time.
Every profitable algorithmic trader I know runs this before touching a live account.
Both platforms skip it entirely.
The fix is to build your validation layer separately, then deploy the code.
My workflow: build foundational breakout models in BreakoutOS, run full in-sample/out-of-sample validation and walk-forward testing, then export the PineScript or MQL5 code directly into TradingView or MetaTrader.
Here is what that looks like.
I used 10 years of E-mini NASDAQ data.
Last 3 years reserved as unseen validation data, never touched during development.
The foundational model tested:
> ATR periods: 5, 20, and 40
> Space multiplier: 2.0
> No filters - raw edge only
ATR multiplier 2.0 ranked number one across all walk-forward periods.
Robustness index: 66%.
Recency alignment with the most recent data: strong.
That model is ready to deploy.
Not because the backtest looked good.
Because it survived tests it was never designed for.
If you found this useful, I published FREE research on why optimizing for win percentage destroys live performance and what to use instead (data from 2,500 strategies).
Read it here:
https://t.co/fJMe4lHZTI
If you found this useful, I published FREE research on how to actually use AI in strategy development, including 7 real case studies with data from 4,100+ strategies.
Read it here:
https://t.co/IhJy65HZt7
One condition. No indicator. No parameter to optimize. It filtered 80% of bad trades from a NASDAQ breakout strategy.
The condition: is the high of the entry bar above today's open?
That's it. One line of code.
If yes, the market has been trading above today's open. There's an established uptrend for the day. Enter the long breakout.
If no, the market is below today's open when your signal fires. You're not in an uptrend. You're trading noise. Skip.
Before:
- Net profit/drawdown ratio: 5.24
- Drawdown: ~$40,000
- Average trade: $120
After:
- Net profit/drawdown ratio: 7.97
- Drawdown: ~$25,000
- Average trade: $162
Net profit went up while drawdown got cut. That's the signature of a genuine filter. It's removing the right trades, not random ones.
Why does it work? Breakout trading is about momentum. If you're buying a breakout to the upside but the market has been trading below its open all day, there's a contradiction. The price level is breaking out, but the day's direction says otherwise. Those trades are the ones that chop you up.
No parameters means no overfitting. This is pure trading logic. You could test it on any long breakout strategy, on any market, in minutes.
The power isn't in complexity. It's in asking the right question.
What's the simplest filter you've ever used?
If you found this useful, I published FREE research on why optimizing for win percentage destroys live performance and what to use instead (data from 2,500 strategies).
Read it here:
https://t.co/fJMe4lHZTI
We asked AI to build a moving average filter for an E-mini NASDAQ strategy. After a few attempts, it came back with something it called a "slope moving average."
The idea: instead of using the moving average value itself, measure the slope. How fast is the average rising or falling? If the slope is positive and steep enough, the trend is strong. If it's flat or declining, stay out.
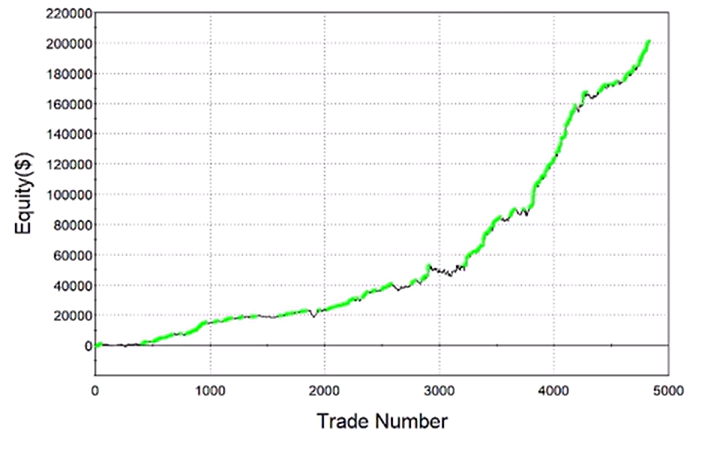
We tested it on NASDAQ first. The equity curve went from choppy and inconsistent to smooth and steadily rising.
But was it real?
That's the question every algo trader has to answer when something looks good in backtesting. Did the AI find a genuine edge, or just a parameter set that happened to fit historical data?
So we tested the slope moving average on completely different markets. Markets it was never designed for. Different volatility, different trading hours, different behavior altogether.
The filter held up.
Not on every market. But enough of them to suggest the underlying concept, measuring trend slope rather than trend level, captures something real about how breakouts work.
Here's what I took away: AI is useful not because it gives perfect answers. It's useful because it suggests ideas you wouldn't test on your own. The slope of a moving average isn't a new concept. But I wouldn't have thought to use it as a filter in this specific way without AI pushing me in that direction.
The human still validates. AI generates combinations of known concepts that a human brain just doesn't reach for on its own. That part is genuinely valuable.
AI didn't replace 20 years of knowledge. It borrowed it, then went somewhere I hadn't.
https://t.co/Jzm3RpAqo6
Most traders blame their strategy… but it’s actually False Breakouts wrecking their results.
Before you tweak anything, run your numbers through this calculator.
You’ll see exactly where the real damage is coming from.
Try it in the comments ↓
We asked AI to build a moving average filter for an E-mini NASDAQ strategy. After a few attempts, it came back with something it called a "slope moving average."
The idea: instead of using the moving average value itself, measure the slope. How fast is the average rising or falling? If the slope is positive and steep enough, the trend is strong. If it's flat or declining, stay out.
We tested it on NASDAQ first. The equity curve went from choppy and inconsistent to smooth and steadily rising.
But was it real?
That's the question every algo trader has to answer when something looks good in backtesting. Did the AI find a genuine edge, or just a parameter set that happened to fit historical data?
So we tested the slope moving average on completely different markets. Markets it was never designed for. Different volatility, different trading hours, different behavior altogether.
The filter held up.
Not on every market. But enough of them to suggest the underlying concept, measuring trend slope rather than trend level, captures something real about how breakouts work.
Here's what I took away: AI is useful not because it gives perfect answers. It's useful because it suggests ideas you wouldn't test on your own. The slope of a moving average isn't a new concept. But I wouldn't have thought to use it as a filter in this specific way without AI pushing me in that direction.
The human still validates. AI generates combinations of known concepts that a human brain just doesn't reach for on its own. That part is genuinely valuable.
AI didn't replace 20 years of knowledge. It borrowed it, then went somewhere I hadn't.
https://t.co/Jzm3RpAqo6