A free site for investors with interactive tools and curated charts on monetary policy, interest rates, inflation, economic indicators, and stock valuation
Happy GPT 5.6 Release Day! 🎉
Codex helped create the new chart on our Fed Funds Rate forecast page.
Track how the forecast for any future date has changed over time, or use the timeline to jump between upcoming FOMC meetings. 📅
https://t.co/TfAeuR5k0w
#GPT56#Fed#Rates
New on StreetStats: Factors & Alternatives 🧭
Track factors as market leadership shifts across cycles.
Follow alternative strategies like risk parity ($ALLW) and managed futures ($DBMF), including asset exposure, leverage, and long/short positioning.
https://t.co/yMkGDkOr0s
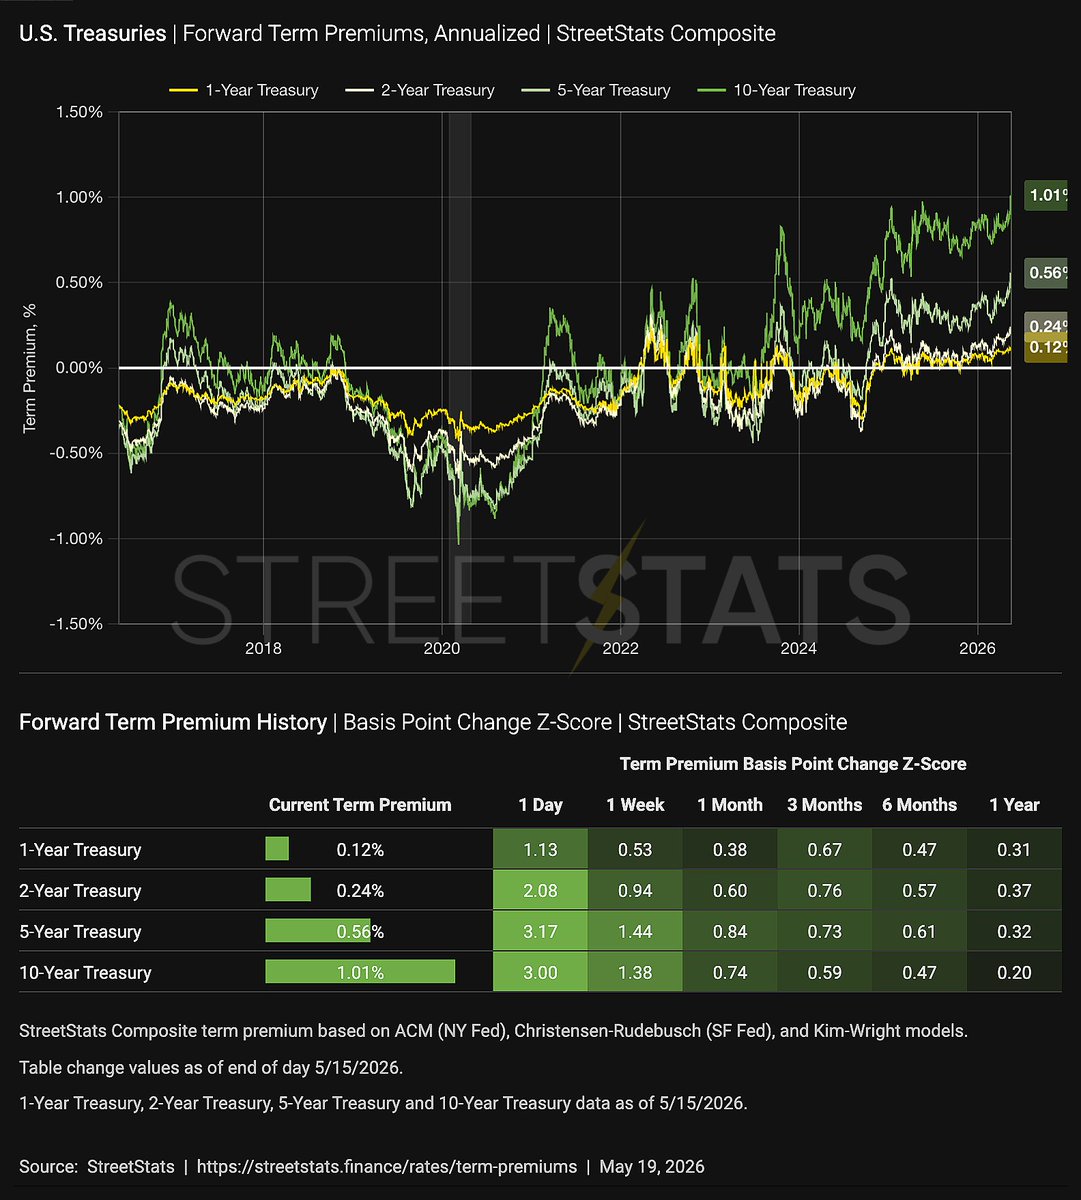
🚨Treasury term premiums just hit their highest levels since 2014.
Investors are demanding more to hold longer-term bonds, pressuring Treasury yields, $TLT, and duration-heavy portfolios. Follow daily on StreetStats!
https://t.co/B28TuYbKUt
#Treasuries#Yields#Bonds#TLT
⚡Introducing our new Energy dashboard⚡
Compare prices and trends across Brent and WTI crude oil, natural gas, U.S. gasoline, and U.S. electricity, with deeper breakdowns for each market.
https://t.co/WzHnfAYHCx
#Oil#Iran#Inflation#Energy#Gasoline#Electricity
💡 Putting that into valuation context:
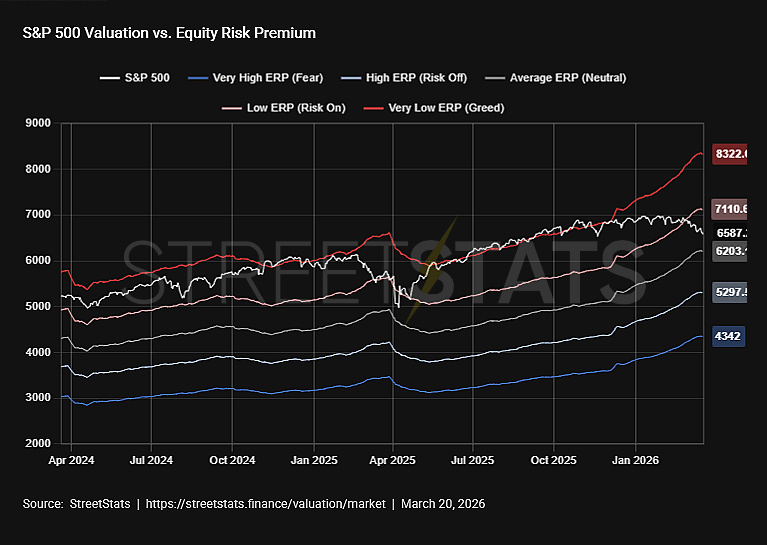
Higher equity risk premiums imply lower fair value multiples for stocks. Our daily Valuation vs. Risk Premium chart plots 5 valuation bands, showing how market valuation can change as investor risk appetite shifts.
@AswathDamodaran
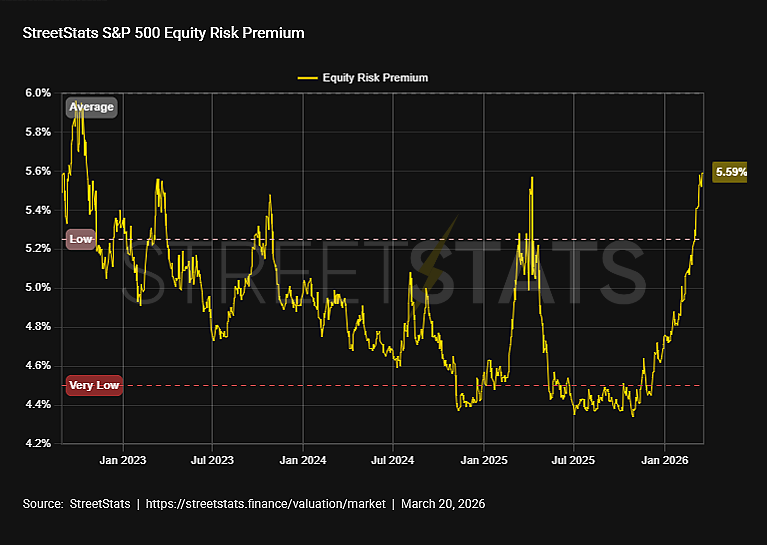
🚨 The S&P 500 Equity Risk Premium is at its highest level in over 3 years.
Investors are demanding more compensation to own stocks as risk aversion rises amid Middle East tensions.
Track our daily updates:
https://t.co/zz7zANCcw7
#SP500#StockMarket#Equities#RiskPremium
📉 After a 9% drop, the S&P 500 is still priced above long-term norms.
🚨 Falling earnings or a rising risk premium could push it lower.
🔍 See market valuation with varying earnings, rates, growth & risk premiums.
#markets#stockmarket#tariffs#SPX#SPY
https://t.co/SSFVB2deFy
📈No rate cut from the Fed today, but at least we got a new dot plot!
🔍Track how rate expectations change day-to-day with interactive forward Fed Funds curves at StreetStats
#Fed#FOMC#DotPlot#Powell#InterestRates
https://t.co/RJ83rjd5jk
@BobEUnlimited We agree! For those without Bloomberg Terminals: If you want to track the real yield across all TIPS maturities, you can view the full TIPS Real Yield Curve (and corresponding breakeven inflation) on StreetStats, free and updated daily.
https://t.co/O9vUF6xtrc