Most alert feeds only show you the winners. StrikeGEX Signals shows every miss too.
It reads every institutional option print on 300+ names and scores it 0 to 100 — size, aggressor, opening OI, repeat hits, plus the one thing other flow feeds skip: whether the print lands with the dealer gamma map or against it. One plain line explains why it fired.
Every print then grades live against a rule we locked before launch: +30% before −50%, first touch, clock to expiry. Wins and losses both stay on the record with the receipt. Nothing deleted, nothing re-scored.
It ships inside the full StrikeGEX map: HeatMap, StrikeChart, Commander, Flow, Live Walls. SPX, SPY, QQQ update every 60 seconds, plus 300+ names on Signals.
14 days for $69. Cancel anytime.
Start here → https://t.co/29BaM4Qsgl
Price history won't show you this:
7700 above $SPX.
7620 below.
Those are the two strikes dealers are actively hedging. The chart shows where price was. The option board shows where flow can matter next.
SPX sits at 7660 with a call wall at 7700 and a put wall at 7620, and neither came from a chart.
Levels here are from the live board as of 10:30 PT and will shift as open interest and price move through the session.
Two of the most useful levels on any gamma map are the call wall and the put wall. They are not trendlines, not moving averages, not anything drawn from price history. They come from the option board itself, and the mechanics behind them are worth understanding in full.
Where the walls come from
Dealers sell options to customers and hedge the resulting exposure in the underlying. Every strike on the board carries some amount of gamma, but the distribution is lumpy. A few strikes carry far more than the rest.
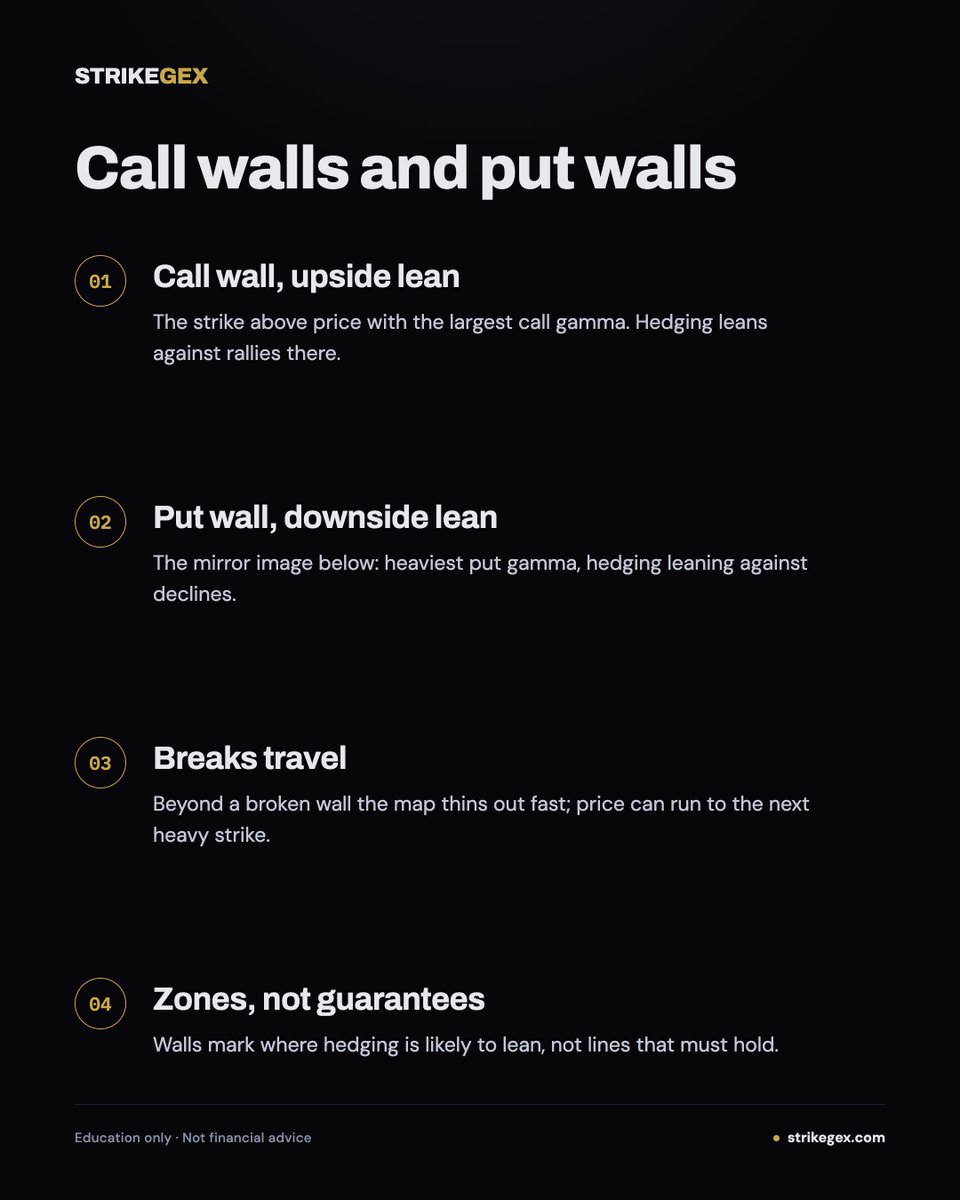
The call wall is the strike above price with the largest call gamma. With SPX at 7660, that is 7700 today, 40 points overhead. The put wall is the mirror image below, the strike carrying the heaviest put gamma. Today that is 7620, 40 points under spot.
Together they frame an 80 point band around the index. That band is not a prediction. It is a map of where hedging pressure concentrates.
Why rallies tend to stall at the call wall
As price climbs toward a strike loaded with call gamma, dealer hedges have to adjust. The net effect of that adjustment is selling into the advance. The closer price gets to 7700, the more supply the hedging flow generates against it.
The result behaves like resistance, but the source matters. Chart resistance is a memory of where sellers showed up before. Wall resistance is a live mechanical flow that exists because of open positions on the board right now. It does not care what price did last week.
This is why moves often lose momentum into a call wall even on days with a strong tape. The rally is not failing on sentiment. It is walking into a hedging flow that leans against it, and the lean gets heavier with every point of approach.
The floor on the other side
The put wall works the same way in reverse. At 7620, the strike with the heaviest put gamma, dealer hedging flows tend to lean against declines. Selloffs approaching that strike run into mechanical buying pressure the same way rallies run into selling at 7700.
That is why the put wall often acts like a floor. Same mechanism, opposite direction. A trader watching SPX drift from 7660 down toward 7620 is watching price move toward the zone where hedging flow is most likely to absorb the decline.
Neither wall requires anyone to believe in it. The flows exist whether or not the market is paying attention, because they are a byproduct of dealers keeping their books flat.
What happens when a wall breaks
Walls concentrate gamma, which means the territory just beyond them is usually thin. When 7700 or 7620 finally gives way, the hedging flow that was leaning against the move is gone, and there is often little exposure at the next few strikes to replace it.
That is the second half of the diagnostic, and it is the half traders forget. The same map that marks where a move should slow also marks where it can accelerate. Price that clears a heavy strike can travel to the next significant one with little in the way, and the trip is often fast precisely because the neighborhood is empty.
So the walls carry two readings at once. Inside the band, expect friction at the edges. Through the band, expect the move to find open road until the next heavy strike.
How to hold this map correctly
The walls are zones, not guarantees. Hedging flow leans; it does not command. Enough directional pressure from real buyers or sellers can push through any strike, and on those days the wall marks the launch point rather than the barrier.
Three things change the picture. If large open interest builds at a new strike intraday, the wall can migrate and the old level loses its flow. If price closes through a wall rather than tagging it, the thin map beyond becomes the active terrain. And every session the board resets, so today's 7700 and 7620 describe today, and only until positioning says otherwise.
Read the walls as a weather report on hedging flow. They tell you where a move is likely to slow down and where it is likely to speed up, which is most of what a level can honestly offer.
SPX sits at 7660 with a call wall at 7700 and a put wall at 7620, and neither came from a chart.
Levels here are from the live board as of 10:30 PT and will shift as open interest and price move through the session.
Two of the most useful levels on any gamma map are the call wall and the put wall. They are not trendlines, not moving averages, not anything drawn from price history. They come from the option board itself, and the mechanics behind them are worth understanding in full.
Where the walls come from
Dealers sell options to customers and hedge the resulting exposure in the underlying. Every strike on the board carries some amount of gamma, but the distribution is lumpy. A few strikes carry far more than the rest.
The call wall is the strike above price with the largest call gamma. With SPX at 7660, that is 7700 today, 40 points overhead. The put wall is the mirror image below, the strike carrying the heaviest put gamma. Today that is 7620, 40 points under spot.
Together they frame an 80 point band around the index. That band is not a prediction. It is a map of where hedging pressure concentrates.
Why rallies tend to stall at the call wall
As price climbs toward a strike loaded with call gamma, dealer hedges have to adjust. The net effect of that adjustment is selling into the advance. The closer price gets to 7700, the more supply the hedging flow generates against it.
The result behaves like resistance, but the source matters. Chart resistance is a memory of where sellers showed up before. Wall resistance is a live mechanical flow that exists because of open positions on the board right now. It does not care what price did last week.
This is why moves often lose momentum into a call wall even on days with a strong tape. The rally is not failing on sentiment. It is walking into a hedging flow that leans against it, and the lean gets heavier with every point of approach.
The floor on the other side
The put wall works the same way in reverse. At 7620, the strike with the heaviest put gamma, dealer hedging flows tend to lean against declines. Selloffs approaching that strike run into mechanical buying pressure the same way rallies run into selling at 7700.
That is why the put wall often acts like a floor. Same mechanism, opposite direction. A trader watching SPX drift from 7660 down toward 7620 is watching price move toward the zone where hedging flow is most likely to absorb the decline.
Neither wall requires anyone to believe in it. The flows exist whether or not the market is paying attention, because they are a byproduct of dealers keeping their books flat.
What happens when a wall breaks
Walls concentrate gamma, which means the territory just beyond them is usually thin. When 7700 or 7620 finally gives way, the hedging flow that was leaning against the move is gone, and there is often little exposure at the next few strikes to replace it.
That is the second half of the diagnostic, and it is the half traders forget. The same map that marks where a move should slow also marks where it can accelerate. Price that clears a heavy strike can travel to the next significant one with little in the way, and the trip is often fast precisely because the neighborhood is empty.
So the walls carry two readings at once. Inside the band, expect friction at the edges. Through the band, expect the move to find open road until the next heavy strike.
How to hold this map correctly
The walls are zones, not guarantees. Hedging flow leans; it does not command. Enough directional pressure from real buyers or sellers can push through any strike, and on those days the wall marks the launch point rather than the barrier.
Three things change the picture. If large open interest builds at a new strike intraday, the wall can migrate and the old level loses its flow. If price closes through a wall rather than tagging it, the thin map beyond becomes the active terrain. And every session the board resets, so today's 7700 and 7620 describe today, and only until positioning says otherwise.
Read the walls as a weather report on hedging flow. They tell you where a move is likely to slow down and where it is likely to speed up, which is most of what a level can honestly offer.
Friday 08/28 outlook, built off today's close.
$SPX closed 7731, right on 7730, the strike that traded heaviest today. Buyers erased the opening dip to 7690 inside fifteen minutes, the rally stalled at 7741, and price settled back on the pivot into the bell. The number overhead is 7750, the biggest strike on the board, ten points above today's high.
The map:
🟡 7750 — the ceiling; heaviest strike on the board
🟢 7730 — pivot; closed right on it
🔴 7720 — first support, thin below it until 7700
Tomorrow's playbook:
➡️ 7720–7750 = chop between the levels
🚀 Above 7750 = 7760, then 7775
💥 Below 7720 = 7700, then 7685
📊 $SPY closed 771.10, dead on 771, its busiest strike. The low printed 767.16, holding a point above 766 support, and the afternoon high at 772.35 faded back under 772. Overhead, 773 and 774 stack as the first ceiling, and 775 behind them carries more size than any strike on the three boards.
🟡 774 — first ceiling; 775 right behind it is the big one
🔴 766 — support; today's low held above it
🚀 Above 775 = 777, then 780
💥 Below 766 = 764, then 763
📊 $QQQ led all day, up 1.4%, and closed at the session high on 721. It never looked back after the 714.50 low. 725 is the biggest thing overhead on its board; under 721 there's nothing solid until 718.
🟡 725 — heaviest strike overhead
🔴 718 — first support
💥 Below 718 = 715, then 713
🚀 Above 725 = 727, then 728
Friday's slate is light: a consumer-sentiment revision at 10am ET and a Fed chair speech, with the week's inflation print and NVDA already behind us. All three closed sitting on their pivot, so the open resolves fast. Pick your number tonight and let price come get it.
7670 is the strike to watch in $SPX.
Gamma isn't spread across the board. A 5-point move around that level can force more dealer hedging than the same move anywhere else.
One SPX strike near 7670 is carrying more dealer gamma than anything else on the board.
That matters because gamma is not spread evenly.
Most strikes are background noise. One strike, sometimes two, does the real work. That outlier is the king node.
With SPX trading around 7670 as of midmorning, 7670 is the strike the rest of the map gets measured against.
Levels here are from the live board as of 10:30 PT and will shift as open interest and price move through the session.
What the king node measures:
Dealers sell options. Then they hedge the exposure in the underlying.
Gamma tells you how fast that hedge has to change when price moves.
Where gamma is concentrated, hedge adjustments are larger and more frequent.
The king node is the strike where that concentration peaks. It is exposure. Not direction.
Simple example:
If the 7670 strike carries three times the gamma of the next largest strike, a 5-point move near 7670 forces more hedge adjustment than the same 5-point move near 7650 or 7690.
The map is showing where the hedge is heaviest.
Why price can pin there:
In positive gamma, dealers are long gamma at the king node.
When price rises toward it, they sell the underlying to stay flat.
When price falls away, they buy.
Rallies get sold. Dips get bought. No opinion needed.
That two-sided flow acts like a spring.
Around 7670, a 10-point pop to 7680 meets sell-side hedging. A 10-point drop to 7660 meets buy-side hedging.
That is how price drifts back toward the strike instead of expanding away from it.
The effect usually gets stronger late in the day.
Same-day options lose time value fast. At-the-money gamma rises into expiry. Hedge adjustments per point get larger in the final hours.
A king node that felt loose at 07:00 PT can feel much tighter after 12:00 PT.
Center of gravity, not a target:
Nobody is aiming at the king node.
It is where customer positioning stacked up, and the dealer hedge flow around that stack changes how price trades.
Think of it as mass on the board.
A heavy strike bends the path around it. It does not decide where price goes. It changes the cost of moving away.
That is also why the king node can move intraday.
New open interest at 7675 or 7700 can shift the peak. The map is a snapshot, and every fill can change the shape.
What pinning looks like:
SPX sits on top of the king node.
Price pushes 8 points above, then fades back.
Pushes 6 points below, then fades back.
Each move away gets smaller as the session ages.
That is pinning.
Every push away creates hedge flow in the opposite direction. The strike does not pull price by itself. The hedging does.
The read is simple:
When SPX spends multiple consecutive reads within a few points of the king node, and each push away is shorter than the last, hedge flow is in control.
When pushes away start getting longer, the concentration is losing grip. Gamma may be building somewhere else, or the regime may be changing.
When the king node stops mattering:
Distance weakens it.
Gamma at a strike fades as price moves away. At 40 or 50 points away, the king node becomes a smaller input.
Other levels matter more there.
The call wall is the heaviest call gamma above spot. It can act as overhead resistance through the same sell-into-strength hedge flow.
The put wall is the heaviest put gamma below spot. It can provide support through dealers buying into weakness.
If SPX were at 7620 with the king node still at 7670, the put wall would likely be doing more work than the king node.
Three things change the read:
If price closes the gap and returns within roughly 10 points of the king node, the spring re-engages and orbit behavior tends to resume.
If a new strike accumulates more gamma than 7670, the king node migrates and the center of gravity moves with it.
If the regime flips to negative gamma, dealers are short gamma at the concentrated strike. Hedge flow reverses. Rallies get bought. Dips get sold.
The same strike that pinned price can start accelerating it away.
That is why the king node is the number traders watch first on a gamma map.
It is not magic.
It is the densest hedge on the board. Dense hedging decides whether a level absorbs price or launches it.
Thursday 08/27 outlook, built off today's close.
$NVDA already reported: $96.2B revenue, +106% YoY, beat on every line, guided next quarter to $108B against a $104B estimate. Options had priced a 5% move. The stock whipped through a 4% range after hours and settled basically flat. When numbers that good move the stock nowhere, the beat was already paid for. Tomorrow doesn't get free fuel from earnings.
$SPX closed 7676, right on the 7675 flow strike. Thin board above until 7715, the heaviest strike up there. Sellers sit at 7725 behind it. Under 7675 there's nothing solid until 7650.
The map:
🟡 7715 — first resistance
🟢 7675 — pivot, close is sitting on it
🔴 7650 — first shelf below
Tomorrow's playbook:
➡️ 7675–7715 = chop, board is thin in between
🚀 Above 7715 = 7725, then 7750
💥 Below 7675 = 7650, then 7625
📊 $SPY closed 766.08. Dipped to 764 midday, got bought, closed near the high. 769 is the biggest strike on the board and price hasn't touched it all week. Friday's high was 767.85. Support is the 764–765 shelf.
🟡 769 — heaviest strike, 3 points up
🔴 765 — support, 764 behind it
🚀 Above 769 = 770, then 774
💥 Below 764 = 760, then 756
📊 $QQQ closed 711.37 on its flow strike, ticked up to ~712.7 after the NVDA print. That opens it inside the 712–720 seller pocket, so 714 gets tested right at the bell. It hasn't printed since Friday. 709 is first support, thin under that until 706.
🟡 714 — first ceiling
🔴 709 — first support
🚀 Above 714 = 716, then 720
💥 Below 709 = 706, then 704
The event everyone waited two weeks for came and went with a shrug. Claims at 8:30 is what's left. Flat reactions to big numbers tend to mean rotation between the heavy strikes, not a trend day. My lean: chop until 7715 or 714 actually breaks.
One SPX strike near 7670 is carrying more dealer gamma than anything else on the board.
That matters because gamma is not spread evenly.
Most strikes are background noise. One strike, sometimes two, does the real work. That outlier is the king node.
With SPX trading around 7670 as of midmorning, 7670 is the strike the rest of the map gets measured against.
Levels here are from the live board as of 10:30 PT and will shift as open interest and price move through the session.
What the king node measures:
Dealers sell options. Then they hedge the exposure in the underlying.
Gamma tells you how fast that hedge has to change when price moves.
Where gamma is concentrated, hedge adjustments are larger and more frequent.
The king node is the strike where that concentration peaks. It is exposure. Not direction.
Simple example:
If the 7670 strike carries three times the gamma of the next largest strike, a 5-point move near 7670 forces more hedge adjustment than the same 5-point move near 7650 or 7690.
The map is showing where the hedge is heaviest.
Why price can pin there:
In positive gamma, dealers are long gamma at the king node.
When price rises toward it, they sell the underlying to stay flat.
When price falls away, they buy.
Rallies get sold. Dips get bought. No opinion needed.
That two-sided flow acts like a spring.
Around 7670, a 10-point pop to 7680 meets sell-side hedging. A 10-point drop to 7660 meets buy-side hedging.
That is how price drifts back toward the strike instead of expanding away from it.
The effect usually gets stronger late in the day.
Same-day options lose time value fast. At-the-money gamma rises into expiry. Hedge adjustments per point get larger in the final hours.
A king node that felt loose at 07:00 PT can feel much tighter after 12:00 PT.
Center of gravity, not a target:
Nobody is aiming at the king node.
It is where customer positioning stacked up, and the dealer hedge flow around that stack changes how price trades.
Think of it as mass on the board.
A heavy strike bends the path around it. It does not decide where price goes. It changes the cost of moving away.
That is also why the king node can move intraday.
New open interest at 7675 or 7700 can shift the peak. The map is a snapshot, and every fill can change the shape.
What pinning looks like:
SPX sits on top of the king node.
Price pushes 8 points above, then fades back.
Pushes 6 points below, then fades back.
Each move away gets smaller as the session ages.
That is pinning.
Every push away creates hedge flow in the opposite direction. The strike does not pull price by itself. The hedging does.
The read is simple:
When SPX spends multiple consecutive reads within a few points of the king node, and each push away is shorter than the last, hedge flow is in control.
When pushes away start getting longer, the concentration is losing grip. Gamma may be building somewhere else, or the regime may be changing.
When the king node stops mattering:
Distance weakens it.
Gamma at a strike fades as price moves away. At 40 or 50 points away, the king node becomes a smaller input.
Other levels matter more there.
The call wall is the heaviest call gamma above spot. It can act as overhead resistance through the same sell-into-strength hedge flow.
The put wall is the heaviest put gamma below spot. It can provide support through dealers buying into weakness.
If SPX were at 7620 with the king node still at 7670, the put wall would likely be doing more work than the king node.
Three things change the read:
If price closes the gap and returns within roughly 10 points of the king node, the spring re-engages and orbit behavior tends to resume.
If a new strike accumulates more gamma than 7670, the king node migrates and the center of gravity moves with it.
If the regime flips to negative gamma, dealers are short gamma at the concentrated strike. Hedge flow reverses. Rallies get bought. Dips get sold.
The same strike that pinned price can start accelerating it away.
That is why the king node is the number traders watch first on a gamma map.
It is not magic.
It is the densest hedge on the board. Dense hedging decides whether a level absorbs price or launches it.
Wednesday 08/26 outlook, built off today's close.
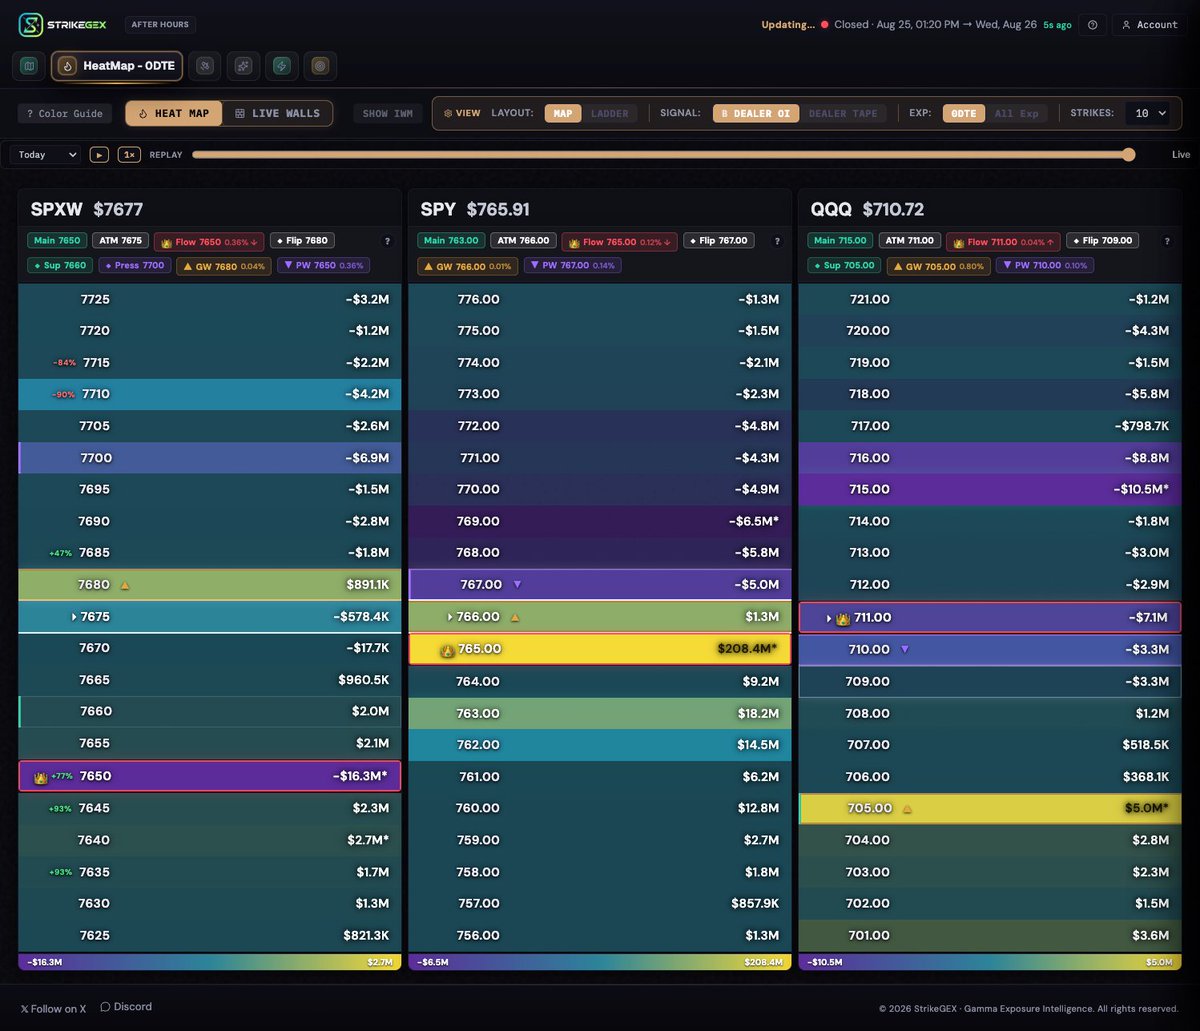
$SPX closed 7677, three points under 7680, the last real shelf overhead before the board goes thin. Clear it and there's nothing solid until 7700, a strike that tends to speed a move up rather than stop it. Below, 7660 is first support, and 7650 is the heaviest strike on the whole board. This morning's dip bottomed right around it and got bought.
The map:
🟡 7680 — first resistance
🟢 7660 — support, holds the upside lean
🔴 7650 — heaviest strike on the board
Tomorrow's playbook:
➡️ 7660–7680 = chop between the levels
🚀 Above 7680 = 7700, then 7710
💥 Below 7660 = 7650, then 7625
📊 $SPY closed 765.91. The morning flush stopped at 763.05, almost exactly on the 763 strike, and the bounce ran into the close. 765 is the heaviest strike across all three boards, and it isn't close, so price tends to orbit it until something forces a break.
🟡 767 — reclaim it and 769 opens, then 770
🔴 765 — the magnet; lose it and 763 is first, 760 behind
🚀 Above 767 = 769, then 770
💥 Below 765 = 763, then 760
📊 $QQQ closed 710.72. It tagged 711.68 in the opening hour, flushed to 707.45, then spent the whole afternoon climbing back to the same ceiling. 711 capped it twice today.
🟡 711 — the lid; through it 715 opens, then 716
🔴 709 — under it, 705 is the next real level
🚀 Above 711 = 715, then 716
💥 Below 709 = 705, then 703
Wednesday stacks PCE and durable goods at 8:30am ET, then NVDA earnings after the bell with a 5% implied move priced. The morning print picks the direction, and the afternoon can go quiet while everyone waits on the report. Whichever way it breaks, it breaks at one of these numbers.
Same strike, two different afternoons: 7720 same-day is a hedge the dealer chases tick by tick. 7720 on the monthly gives him 50 points of room before he even looks at it. That gap is why the map starts with the 0DTE board.
A 7720 strike expiring today hedges harder than the same strike a month out.
SPX is trading near 7720 as of midmorning. Two options share that strike. One expires at today's close. One expires next month. Same underlying, same strike, same side of the market, and the dealer who is short each one has a completely different afternoon in front of him.
That gap is the whole reason the daily map is built from the same-day board first.
Time is the variable that concentrates gamma
An option's delta measures how much it behaves like the underlying. Out of the money, delta sits near zero. Deep in the money, it sits near one. Gamma is the speed of that transition, how fast delta changes as price moves.
With a month of life left, the 7720 strike has room. Price can drift 50 points either way and the option's delta moves gradually, because there is still time for the index to come back. The transition from near zero to near one is spread across a wide band of prices.
With a few hours left, that band collapses. Settlement is coming at the close, and the option will finish either worth something or worth nothing. A 7720 strike that is 5 points out of the money at 2:30 PM ET behaves very differently than one that is 5 points in the money. The delta swing that took 100 points to complete next month now completes in maybe 10 or 15 points today.
Same strike, same gap, but the whole delta transition is compressed into a sliver of price. That compression is gamma, and it is why a 0DTE contract carries far more gamma per dollar of premium than anything further out.
What a dealer has to do about it
A dealer short an option is short gamma. To stay flat, the dealer hedges with the underlying, buying as price rises through the strike and selling as it falls back. The size of that hedge equals the change in delta.
Walk the 7720 example. Price moves from 7715 to 7725. For the monthly contract, delta might shift a few percent, so the dealer adjusts a small fraction of the position. For the same-day contract, that same 10-point move can carry delta across most of its range, so the dealer has to trade a large fraction of the notional in one go.
The move in the index was identical. The hedge it forced was not. A little price change produces a lot of hedging, and that hedging trades in the direction of the move when dealers are short gamma. Price rising through 7720 means dealers buy; price falling back through it means dealers sell.
That is the diagnostic worth keeping. When a large short-gamma same-day strike sits close to spot late in the session, the mechanics say moves through that strike get pushed rather than absorbed.
Sum it across the board
One strike is a story. The full same-day board is the tape.
Every 0DTE strike near spot carries this compressed gamma, and open interest clusters around round numbers and recent ranges. Take the strip around 7720: 7700, 7710, 7720, 7725, 7730, 7750. Each one is a hedging obligation that sharpens as the clock runs down. Add them together and the dealer community is sitting on a wall of delta that can flip sign across a narrow price range.
That aggregate is why afternoons behave differently than mornings. At 10:30 AM ET, a 0DTE option still has five and a half hours of life, and its gamma, while elevated, is spread across a workable band. By 2:00 PM ET the band is tighter. By 3:30 PM ET it is tighter still, and the hedging flow needed to stay neutral has to happen in a shrinking window.
The clock does the compressing
Reconstruct the arc of a single session in mechanics terms. At the open, same-day gamma is already higher per dollar than any other expiry, but dealers can hedge incrementally because price has room to oscillate before settlement matters. Into the lunch hour, the delta band around each strike narrows and the hedge ratio per point of index move climbs.
Into the final hour, every strike near spot is close to binary. A dealer short the 7720 strike with SPX at 7722 is nearly fully hedged; a drop to 7718 unwinds most of that hedge. Price that crosses a populated strike in the final 60 minutes forces the biggest hedge-per-point of the entire day, and that is the same-day gamma concentrating exactly where the thread says it does, in the last hours.
Where the longer-dated board still matters
None of this makes monthly or weekly gamma irrelevant. Larger open interest at longer expiries defines the broad structure: where dealers are long gamma and dampen moves, where they are short and amplify. Those levels hold their meaning across days, not hours.
But on any single session, the positioning most likely to move the tape is the positioning that expires today. It has the most gamma per dollar, the sharpest delta, and the tightest hedging window. Building the map 0DTE first is simply weighting the inputs by how much hedging each one can force before the close.
What changes the picture
Three things move the read. If same-day open interest is thin near spot, the compression still happens but there is little notional behind it, and the afternoon stays quieter than the mechanics alone would suggest. If price sits between two large same-day strikes into the final hour, say 7700 and 7750 with spot at 7720, the hedging flow has two targets and the direction of the break decides which set of dealers has to chase. If dealers are net long gamma at the nearest strikes, the same compression works in reverse, and hedging leans against the move instead of with it.
Expiration day is when gamma is most concentrated and hedging is most reactive. The closer to the close, the stronger the effect, and the same-day board is the first thing to read.
A 7720 strike expiring today hedges harder than the same strike a month out.
SPX is trading near 7720 as of midmorning. Two options share that strike. One expires at today's close. One expires next month. Same underlying, same strike, same side of the market, and the dealer who is short each one has a completely different afternoon in front of him.
That gap is the whole reason the daily map is built from the same-day board first.
Time is the variable that concentrates gamma
An option's delta measures how much it behaves like the underlying. Out of the money, delta sits near zero. Deep in the money, it sits near one. Gamma is the speed of that transition, how fast delta changes as price moves.
With a month of life left, the 7720 strike has room. Price can drift 50 points either way and the option's delta moves gradually, because there is still time for the index to come back. The transition from near zero to near one is spread across a wide band of prices.
With a few hours left, that band collapses. Settlement is coming at the close, and the option will finish either worth something or worth nothing. A 7720 strike that is 5 points out of the money at 2:30 PM ET behaves very differently than one that is 5 points in the money. The delta swing that took 100 points to complete next month now completes in maybe 10 or 15 points today.
Same strike, same gap, but the whole delta transition is compressed into a sliver of price. That compression is gamma, and it is why a 0DTE contract carries far more gamma per dollar of premium than anything further out.
What a dealer has to do about it
A dealer short an option is short gamma. To stay flat, the dealer hedges with the underlying, buying as price rises through the strike and selling as it falls back. The size of that hedge equals the change in delta.
Walk the 7720 example. Price moves from 7715 to 7725. For the monthly contract, delta might shift a few percent, so the dealer adjusts a small fraction of the position. For the same-day contract, that same 10-point move can carry delta across most of its range, so the dealer has to trade a large fraction of the notional in one go.
The move in the index was identical. The hedge it forced was not. A little price change produces a lot of hedging, and that hedging trades in the direction of the move when dealers are short gamma. Price rising through 7720 means dealers buy; price falling back through it means dealers sell.
That is the diagnostic worth keeping. When a large short-gamma same-day strike sits close to spot late in the session, the mechanics say moves through that strike get pushed rather than absorbed.
Sum it across the board
One strike is a story. The full same-day board is the tape.
Every 0DTE strike near spot carries this compressed gamma, and open interest clusters around round numbers and recent ranges. Take the strip around 7720: 7700, 7710, 7720, 7725, 7730, 7750. Each one is a hedging obligation that sharpens as the clock runs down. Add them together and the dealer community is sitting on a wall of delta that can flip sign across a narrow price range.
That aggregate is why afternoons behave differently than mornings. At 10:30 AM ET, a 0DTE option still has five and a half hours of life, and its gamma, while elevated, is spread across a workable band. By 2:00 PM ET the band is tighter. By 3:30 PM ET it is tighter still, and the hedging flow needed to stay neutral has to happen in a shrinking window.
The clock does the compressing
Reconstruct the arc of a single session in mechanics terms. At the open, same-day gamma is already higher per dollar than any other expiry, but dealers can hedge incrementally because price has room to oscillate before settlement matters. Into the lunch hour, the delta band around each strike narrows and the hedge ratio per point of index move climbs.
Into the final hour, every strike near spot is close to binary. A dealer short the 7720 strike with SPX at 7722 is nearly fully hedged; a drop to 7718 unwinds most of that hedge. Price that crosses a populated strike in the final 60 minutes forces the biggest hedge-per-point of the entire day, and that is the same-day gamma concentrating exactly where the thread says it does, in the last hours.
Where the longer-dated board still matters
None of this makes monthly or weekly gamma irrelevant. Larger open interest at longer expiries defines the broad structure: where dealers are long gamma and dampen moves, where they are short and amplify. Those levels hold their meaning across days, not hours.
But on any single session, the positioning most likely to move the tape is the positioning that expires today. It has the most gamma per dollar, the sharpest delta, and the tightest hedging window. Building the map 0DTE first is simply weighting the inputs by how much hedging each one can force before the close.
What changes the picture
Three things move the read. If same-day open interest is thin near spot, the compression still happens but there is little notional behind it, and the afternoon stays quieter than the mechanics alone would suggest. If price sits between two large same-day strikes into the final hour, say 7700 and 7750 with spot at 7720, the hedging flow has two targets and the direction of the break decides which set of dealers has to chase. If dealers are net long gamma at the nearest strikes, the same compression works in reverse, and hedging leans against the move instead of with it.
Expiration day is when gamma is most concentrated and hedging is most reactive. The closer to the close, the stronger the effect, and the same-day board is the first thing to read.
Tue 08/18 market outlook and playbook, read off the 10:22 ET board. It's a live map, so the numbers shift with the tape.
$SPX is down 43 on the day at 7702, sitting right on 7700, the heaviest strike near price. Yesterday's fade never stopped: SPY opened Monday at 776 and closed at the low, then gapped down again this morning and hasn't traded above 769.50 since the bell. So the tape has been one direction for two sessions and price is now resting on the first real number under it.
Above 7700 the board is thin until 7720. Get through 7720 and moves speed up, because there is nothing between it and the 7730–7750 stack, where 7740 is the biggest strike on the whole board and the lid for the day. Below 7700, 7690 is the only support with size. Under that it thins out to 7670, then 7650.
The map:
🟡 7720 — first resistance. Through it, 7740 comes fast
🟢 7700 — the line. Hold it and the bounce lean is on, lose it and 7690 is next
🔴 7690 — first support. 7670 behind it, then 7650
➡️ 7690–7720 = chop
🚀 Above 7720 = 7740, then 7750
💥 Below 7690 = 7670, then 7650
SPY is at 768.23, pinned on 768, which is by far the biggest strike on any of the three boards. Monday closed 772.66 and this morning opened 768.70, so 770 hasn't been touched today. That's the number to reclaim. Underneath, 767 is the first support and 766 is where things loosen up.
🟡 770 — reclaim it and 773 opens, then 775
🔴 767 — first support, 766 right behind it, then 764
🚀 Above 770 = 773, then 775
💥 Below 767 = 766, then 764
QQQ is the weak one, down 1.6% at 717.94, twelve points off Monday's close. The lid is a stack: 720, 721 and 722 are all heavy, so a bounce runs into three walls in a row. Below, 716 is the last support with size. 715 sits under it and past that the board is thin down to 713 and 710.
🟡 720 — the lid, with 721 and 722 stacked behind. Reclaim it and 724 opens
🔴 716 — last support of size. Lose it and 713 is next, then 710
🚀 Above 720 = 722, then 724
💥 Below 716 = 713, then 710
The data calendar is done for the day. All three boards read the same way: price sitting on the biggest strike near it, a heavy lid a few points up, thin air under the first support. Two days of selling and no bounce yet. Whether 7700 is a floor or a rest stop gets decided in the next hour, so mark 7700 and 7690 and let one of them break before you lean. ⚠️
$SPX is sitting right on the largest 0DTE gamma concentration today: 7775 (King Node).
Call Wall 7775 / Put Wall 7765, spot 7775.
Net GEX +57M. Positive net gamma: dealer hedging leans against price moves near the heavy strike.
Monthly OPEX lands Friday Aug 21.
Biggest gamma roll-off of the month.
Week-ahead $SPX positioning, Aug 17-21:
weekly King Node 7850 · Call Wall 7850 · Put Wall 7700
Net GEX across the week's expiries $+153M.
Levels are from the close and will update at the market open.
Tmr Friday 08/14 Market Outlook and Playbook base on today close, at open these levels will change.
$SPX closed 7799, up 50 on the day and a point under 7800, with the 7825 wall overhead. Here's the map:
🟡 7800 — First resistance. Clear it early and 7815 opens, then 7825.
🟢 7790 — Main level to watch. Stay above it and the upside lean is intact.
🔴 7775 — First target if 7790 fails. Heaviest strike on the board, with 7750 behind it.
Tomorrow's playbook:
➡️ 7790–7800 = chop between the levels
🚀 Above 7800 = 7815, then 7825
💥 Below 7790 = 7775, then 7750
📊 $SPY — closed 777.88, two points under the biggest strike anywhere on the map
🟡 780 — The pivot. Reclaim it and 782 opens, then 788.
🔴 776 — First support. 775 is right behind it.
🚀 Above 780 = 782, then 788
💥 Below 776 = 775, then 773
📊 $QQQ — closed 732.07, pinned on the 732 line with a heavy lid two points up
🟡 734 — The lid. Heaviest strike on the QQQ board. Through it, 735 opens, then 740.
🔴 729 — First support if 732 goes. 728 sits right behind it.
🚀 Above 734 = 735, then 740
💥 Below 732 = 729, then 724
Tomorrow comes down to 7800. SPY's biggest strike sits at 780, the same price, and both closed right under it. Lose 7790 and the read shifts to 7775. Let price leave the line before you trust either side. ⚠️
Twenty SPX points can change the whole tape.
At 7760, the move gets absorbed. At 7740, the move can start feeding on itself. Same headlines. Same index. Different dealer hedge.
One curve, one zero crossing
Dealer gamma is not one static number. It moves with price.
Somewhere on that curve, net dealer exposure crosses from positive to negative. That point is the gamma flip.
It matters because the hedge changes there.
With SPX near 7750 on the mid-morning read, the flip can sit only a few points from spot. That is close enough for normal intraday rotation to move the index from one regime to the other, sometimes several times in the same session.
Above the flip, hedging absorbs
Above the flip, net dealer gamma is positive.
Dealers are long options as a group. As price rises, their hedge deltas grow. As price falls, those deltas shrink. To stay flat, they sell futures into upticks and buy futures into downticks.
That is not a call on direction. It is hedge math.
At 7760, ten points over a flip near 7750, strength runs into mechanical supply. Weakness runs into mechanical demand. Moves get dampened. The range gets tighter. The tape feels heavy both ways.
That is positive gamma from the outside: price leaning against its own momentum.
Below the flip, hedging amplifies
Below the flip, the sign reverses.
Net dealer gamma is negative. Now staying flat means selling into weakness and buying into strength.
The same ten-point move that got absorbed at 7760 can extend at 7740. A dip brings hedge selling. That selling pushes price lower. Lower price brings more hedge selling.
Rallies work the same way in reverse.
The flow that stabilized the tape above the flip becomes the accelerant below it. No dealer has to choose a direction. The exposure does it for them.
That is why one level can act like a switch.
Same index. Same headlines. Same participants. Cross the boundary and the tape starts responding differently.
The boundary moves during the day
The flip is not fixed.
It is built from live positioning, and that positioning changes as new options trade. A strike that supported positive exposure in the morning can get overwhelmed by fresh flow later. The zero crossing moves with the book.
That makes any flip read a snapshot.
The 7750 area reference here is as of 10:30 PT. Treat it as a location at that moment, not a line that keeps the same meaning all day.
There is a tell in the tape.
When the same size flow starts moving price farther than it did an hour earlier, price is likely operating on the negative side of the flip, whatever the morning map said.
When moves keep dying a few points after they start, hedging supply and demand are probably absorbing flow on the positive side.
What confirms or breaks the read
Three things matter from here.
If price holds above the flip and positioning builds there, hedge pressure keeps compressing the range. Quiet tape is the expected output.
If price sets up below the flip, the same hedge math forces dealers to chase moves. Fast two-way tape is mechanical, not a sudden sentiment shift.
If the flip itself moves toward spot as the session's flow rebuilds, the distance between calm and fast gets smaller.
A market sitting on top of its own flip is a market where small moves change the rules.
Knowing which side of the flip price sits on does not tell you where SPX goes next. It tells you how SPX is likely to move on the way.
That difference between 7760 behavior and 7740 behavior can be the entire character of the day.
Midday read 📍
$SPX settled into the chop box: 7760–7775, price sitting on the bottom edge. The heaviest strikes stacked at 7775/7780, so upside is a grind through walls. If 7760 gives, 7740 is the downside target.
SPY pinned under 774, its biggest strike. Clear it and 777 is the next stop. Lose 772 and 769 opens.
QQQ boxed 724–720, and its 724 wall is the heaviest strike anywhere on the map today. Rangebound until one side breaks.