The S&P 500 is sitting near record highs.
But the internals are weak.
As of Wednesday, 257 of the 500 stocks in the index were trading below their 200-day moving averages.
That’s more than half the index underwater on a
widely watched long-term momentum measure.
Breadth is bearish.
Now look at crypto.
Of the top 100 tokens by market cap, 88, including Bitcoin and Ethereum, are trading above their 200-day SMAs.
Most of those same coins are also holding above their 50-day and 100-day averages.
That’s a clean, bullish configuration across the board.
And here’s the part that stands out: $BTC, $ETH, $XRP, $SOL and the majority of the rest are still well below their all-time highs.
They look relatively inexpensive compared with equities that are already pricing in a lot of good news.
Weak breadth in stocks near highs has historically been a yellow flag.
Strong breadth in crypto while prices remain far from peaks is the opposite setup.
The data doesn’t lie.
Markets are bracing for a rate hike.
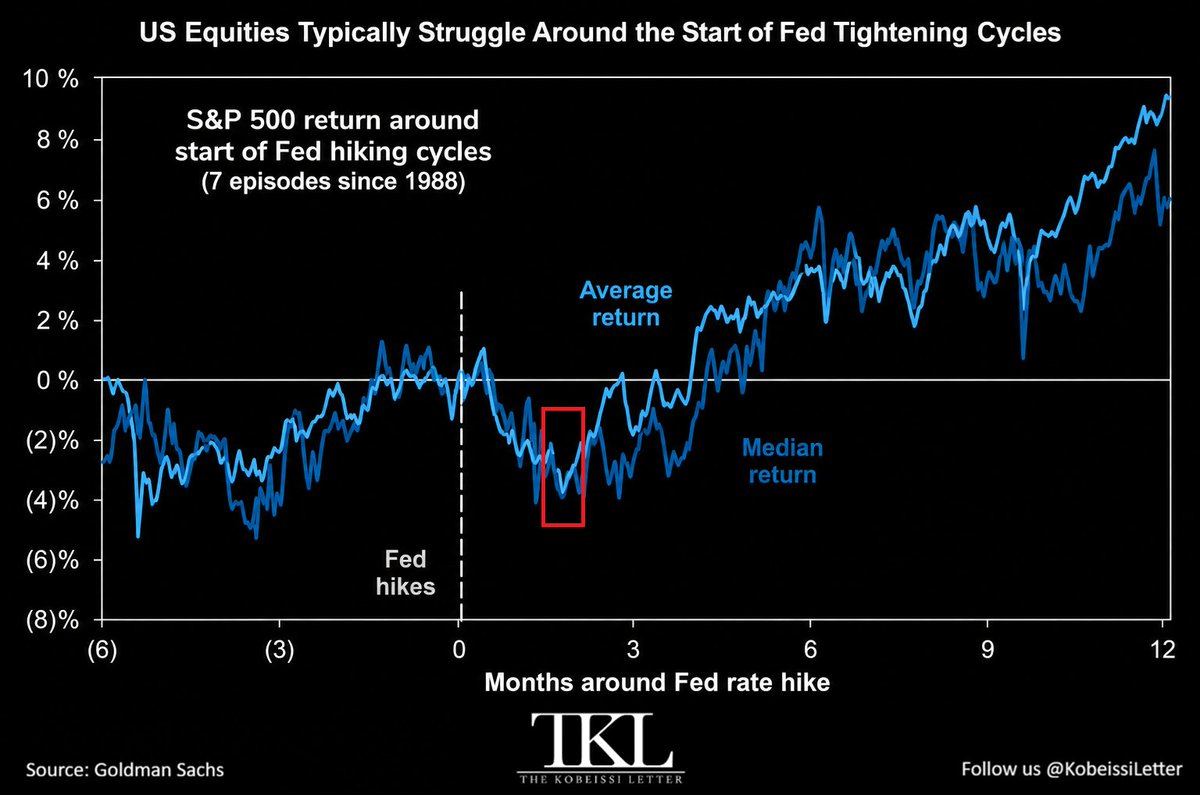
So, how do US stocks usually behave following the first hike of a Fed tightening cycle?
The S&P 500 has declined by an average of -4.0% over the 6 weeks following the first Fed rate hike of a cycle across 7 such episodes since 1988.
Subsequently, however, stocks recovered all of those losses over the next 5-6 weeks on average.
Then, in the 6 months following the first hike, the S&P 500 returned +4.0% on average.
After 12 months, the S&P 500’s average gain surged to +9.0%, with positive returns occurring in every episode except 2022.
Fed rate hikes have historically been great buying opportunities.
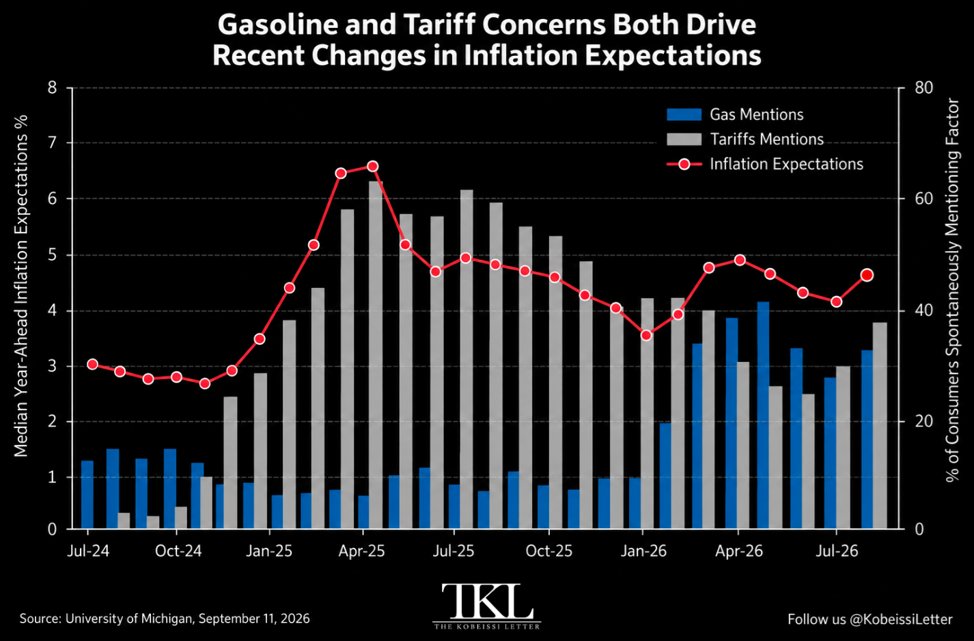
Inflation expectations skyrocketing among Americans:
US consumers now expect inflation to rise to ~4.6% over the next year, the 3rd-highest reading over the last 12 months.
This is now 1.1 percentage points above the level seen at the start of 2026.
This comes as the proportion of consumers spontaneously mentioning gasoline as a concern rose to ~30%, its 4th-highest in at least 2 years.
At the same time, ~37% of consumers mentioned tariffs, the highest proportion since April.
Americans think another wave of inflation has begun.
As shown in our analysis below, there is a near-perfect correlation between oil prices and US CPI inflation.
Oil prices are up another +22% since the last CPI inflation report was released on August 12th.
It's pretty clear what comes next.
Stan Druckenmiller told Scott Bessent exactly what it would take to stop Washington from spending: "the clowns in Washington - unless they get a signal from the bond market, they're just going to keep spending"
what follows is him walking through the math nobody bothers to do on corporate America, the reason a single Trump tweet took him from 93% invested to flat, and what he believes the Fed has actually constructed over the past decade
"when the Trump tweet went out I went from 93% invested to net flat. not because I'm trying to make money - I just don't want to play in this environment"
"corporate debt went from $6 trillion to $10 trillion. profits went from $1.7 to $2.2 trillion. and the interest cost on that extra $4 trillion only went up 23%. you'd think profits would explode with that formula. they went up 29% - over eight years"
"we have all these zombies walking around. the most innovative period since the late 1800s, and you're hardly seeing bankruptcies - because there have been no market signals from the Fed"
"if I were trying to create a deflationary bust, I would do exactly what the world central banks have been doing"
save this and watch the conversation in full - then read the article below ↓
BREAKING: Claude can now run Stock Market research like a top consulting firm (for free).
Here are 10 Claude prompts that replace $100K/year stock analysts (Save for later)
🚨 Anthropic just showed a 24-minute workshop on how to actually do prompts for Claude.
Taught by the people who built it.
Free. No registration. No paywall.
I've seen $300 courses that don't cover what they teach in the first 8 minutes.
Watch it and bookmark it now.
Digital Credit. Digital Money. Digital Equity. Digital Treasury.
My conversation with @ColeMacro at @BTCPrague on the future of capital markets, followed by Q&A on the nuances of Bitcoin-backed securities and corporate finance.
Bitcoin to $1M isn't a prediction.
It follows a law of nature.
@Giovann35084111 joins me to break down the Power Law governing Bitcoin's price trajectory.
The same pattern exists behind earthquakes, galaxies, the growth of cities, the internet's adoption and more.
TIMESTAMPS:
00:00 What is Bitcoin Power Law Theory?
7:58 What Does Bitcoin Power Law Explain?
14:03 The Bitcoin Chart You Can't Unsee
14:52 Bitcoin's Price = Time to the Power of ~6
21:30 Bitcoin Follows Laws of Nature, Just Like the Universe
26:22 97% of Bitcoin's Behavior Explained by One Equation
33:37 Bitcoin's Addresses Grow Like the Internet, But Faster
34:10 Why Bitcoin Is a Bottom-Up Network, Not an S-Curve
37:44 Does the Power Law Apply to Gold or Nvidia? No. Here's Why.
39:18 S&P 500 Is Just Beating Inflation - Bitcoin Is Something Else
49:43 Price Predictions: $120K in 2026, $1M in 8 Years, $10M in 20?
56:40 Bitcoin Has Gone Up 100 Million Times. Still Has 100x Left.