@userofintellect You have are great teacher professor and really can't thank you enough for all the work you and your team at EZPZ trading have done. These are amazing tools, but you need to have a plan to use them. To all the retail traders out there, keep working on your craft.
Bullish signal at the open. Do you buy it? 🎥👇
Friday morning, the EZPZ Intraday Market Regime flagged $COST as one of the top bullish names:
• Score: +64 (BULLISH)
• Conviction: High
• Trend: All 3 timeframes green
Most retail traders hit buy immediately. I didn't. Here’s why:
Finn’s trade plan mapped a yellow No-Trade Zone between $1014.53 and $1021.45:
🟢 Bullish Trigger: Break above $1021.45 (High of Day)
🔴 Bearish Trigger: Breakdown below $1014.53 (Low of Day)
🟡 Current Price: $1020.00 (Trapped in chop)
The signal said Bullish, but the plan said: WAIT.
What happened next:
1️⃣ Price never broke the $1021.45 bullish trigger
2️⃣ Slipped below $1014.53 to trigger the fade
3️⃣ Sliced into Target 1 ($1012.77) & Target 2 ($1010.00 Gamma Flip)
4️⃣ Backtested $1012.77: Old support became new resistance
5️⃣ Flushed into Target 3 ($1007.31) and closed near $1003.50
Anyone who bought the "bullish signal" at $1020 sat down $16/share into the close. Meanwhile, the EZPZ Intraday Market Regime flipped from +64 down to -49 Bearish.
The Golden Rule:
A signal is context. The level is the trigger.
Map levels in seconds with FINN EZPZ AI for @tradingview:
https://t.co/lBT5EQvGUY
*NFA. Educational purposes only.*
#COST #DayTrading #OptionsTrading #TradingView #AITrading #RiskManagement #StockMarket
5 tickers. 5 plans. 2 trades taken. Both closed green 🎯 (Full Friday breakdown attached 🎥)
The power of letting FINN EZPZ AI map the structure on @tradingview:
🟢 $TSLA — Breakdown under $367.78: 365 Puts filled $1.90 ➡️ $2.35 (+23.6%)
🟢 $MU — Breakout over $882.26: 900 Calls filled $3.01 ➡️ trimmed $3.60 & $4.20 (+39.5%)
🔄 $SPY — Reclaimed $761.20 bullish trigger ➡️ hit T1 Gamma Flip ($763.00)
🛑 $AMZN — -57 Bearish score, but never cracked $246.45 trigger = 0 trades
🛑 $META — Sat in the $639–$650 chop box all day = 0 trades Conviction isn’t a trigger—the level is.
If it doesn't break the box, you don't take the trade. Check out the AI connector: https://t.co/lBT5EQvGUY
Educational only. NFA.
#StockMarket #DayTrading #TradingView #OptionsTrading #RiskManagement
Draw on my SPY chart with clean horizontal lines and price labels for both top trade idea bullish path, strictly in green, and for the top trade idea bearish path strictly in red, include 3 price targets. Put a cloud or highlight in yellow no trade zones (between bullish and bearish entries).
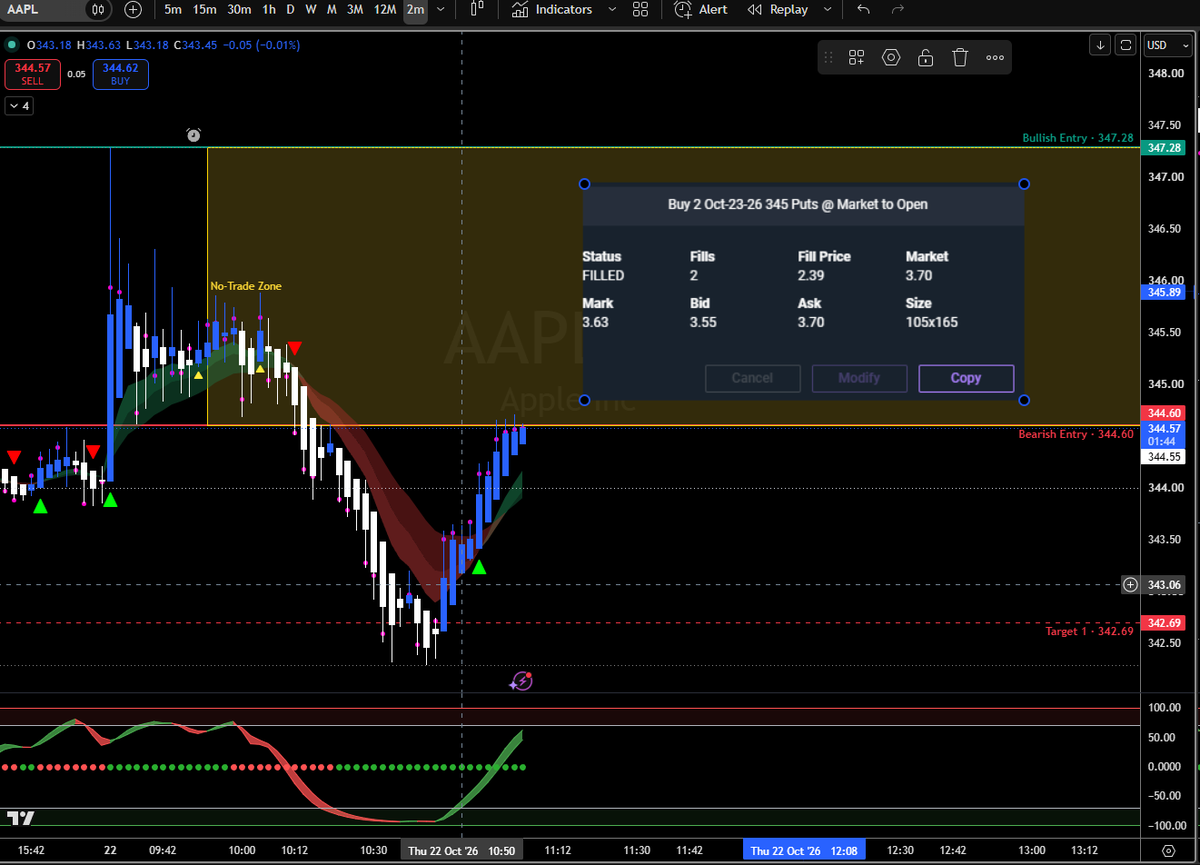
Another clean execution today on $AAPL using levels mapped directly to @tradingview via the FINN EZPZ AI connector 🎯
The Setup:
🟡 No-Trade Zone: $344.60 – $347.28 (sidelined in chop all morning)
🔴 Bearish Trigger: Clean breakdown below $344.60
The Trade:
• Waited out the yellow box compression
• As soon as $344.60 cracked, triggered 2x Oct-23-26 345 Puts filled @ $2.39
• Contracts ripped to $3.70 market price (+54.8%) as $AAPL sliced straight into Target 1 ($342.69)
No guessing inside the noise.
Let the institutional boundaries define the risk, then execute the breakout.
Learn more about the AI connector: https://t.co/lBT5EQvGUY
NFA. Educational purposes only. #AAPL #DayTrading #OptionsTrading #TradingView #AITrading #StockMarket
5 tickers, 5 trade plans, 1 simple rule: If it's inside the yellow box, don't touch it 🛑📊 (Full recap in the clip 🎥)
Today’s tape breakdown with FINN EZPZ AI levels:
🟡 $NVDA — Trapped in the box all day. Tons of fake signals, but 0 trades taken.
🟡 $TSLA — 6 straight hours of pure chop inside the range. Capital preserved.
🟢 $MU — Clean break above $907.25 ➡️ Hit T1 ($916.13).
🟢 $SPY — 2-hour base, broke $771.23 ➡️ Ran through T1 & T2.
🔴 $META — Trailed stop saved the morning trap; 3 PM breakdown below $704.50 hit T1 & T2.
You don't need to catch every move—you just need to stay out of the chop and execute when institutional edges break. Not Financial Advice.
Automate your levels on TradingView: https://t.co/lBT5EQvGUY
#StockMarket #DayTrading #TradingView #FinTech #RiskManagement #NFA #EZPZTRADING
Did $SPY respect FINN’s levels today? Every single pivot played out live 🎥👇
The Setup & Execution:
🟡 Sidelined in the No-Trade Zone early on ($769.73 – $771.23)
🔴 Bearish trigger hit T1 at $768.53 (missed it while working)
🟢 Reclaimed $771.23: Entered SPY 773 Calls at $0.47
The Exit:
🎯 Target 1 ($773.00 Call Wall): Trimmed 1st contract: $0.47 ➡️ $0.85 (+80%)
🎯 Target 2 ($774.43 Upper Expected Move): Runner scaled: $0.47 ➡️ $1.40 (+197%)
And right into the close? A flush straight back to the $771.23 bullish entry level where buyers stepped right back in.
Institutional levels plotted automatically on @tradingview before taking a single trade. NFA
Check out the AI connector: https://t.co/lBT5EQvGUY
#SPY #DayTrading #OptionsTrading #TradingView #AITrading #ezpztrading
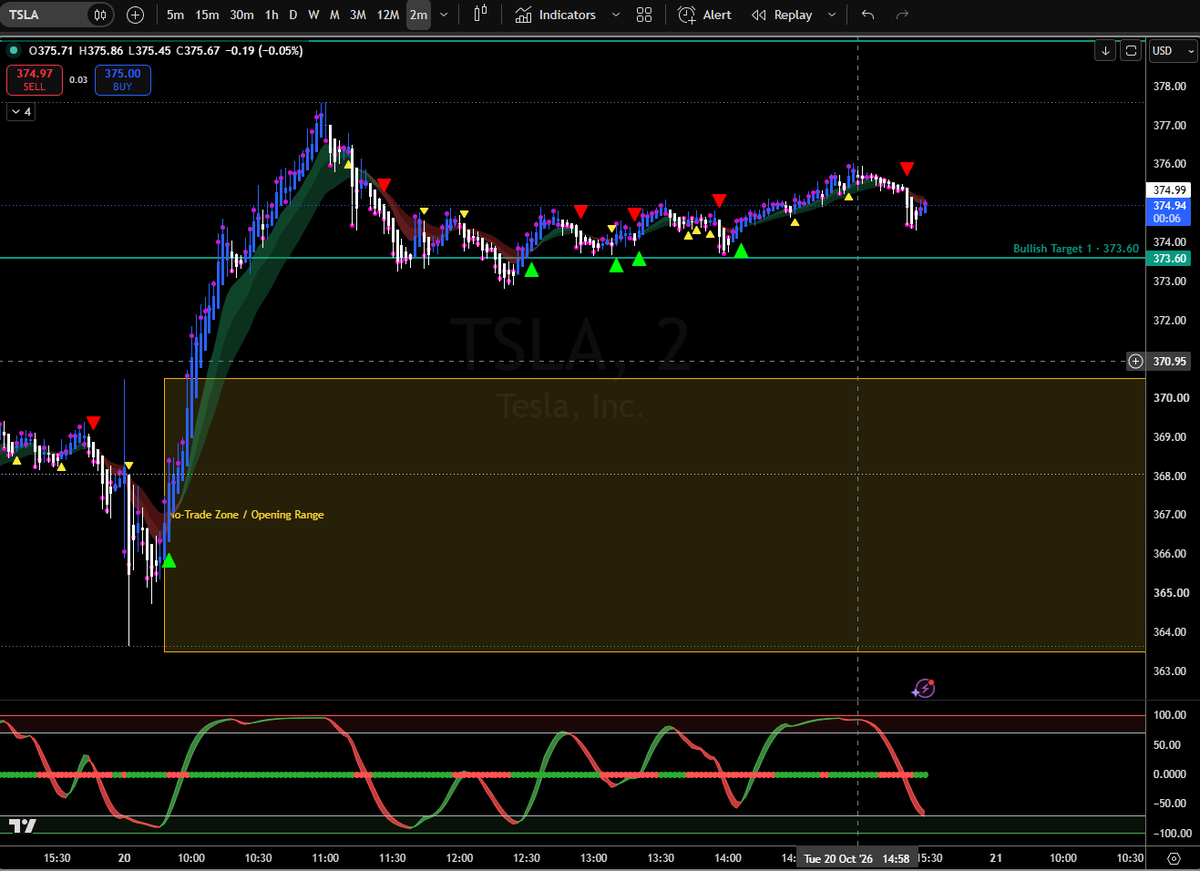
How I traded $TSLA today with levels mapped straight to @tradingview using the FINN EZPZ AI connector 🎯
The Plan:
🟡 No-Trade Zone: $363.50 – $370.50 (sidelined in chop between Dark Pool & VWAP)
🟢 Bullish Trigger: $370.50 (ORH + Positive GEX)
🔴 Bearish Trigger: $363.50 (ORL + Daily Pivot breakdown)
The Targets:
🟢 Bullish Expansion:
🎯 T1: $373.60 (R1)
🎯 T2: $379.15 (R2)
🎯 T3: $388.71 (13-Week High / R3)
🔴 Bearish Expansion:
🎯 T1: $360.00 (Gamma Flip / GEX floor)
🎯 T2: $354.47 (Prev Day Low)
🎯 T3: $348.93 (S2 Support)
No guessing, just clean algorithmic levels plotted directly on the chart. I usually take 1/2 off at Target 1 and trail up stop. Got stopped out on TSLA261023C390, but made a nice profit.
Check out the AI connector: https://t.co/lBT5EQweKw
#TSLA #DayTrading #TradingView #AITrading #StockMarket #OptionsTrading
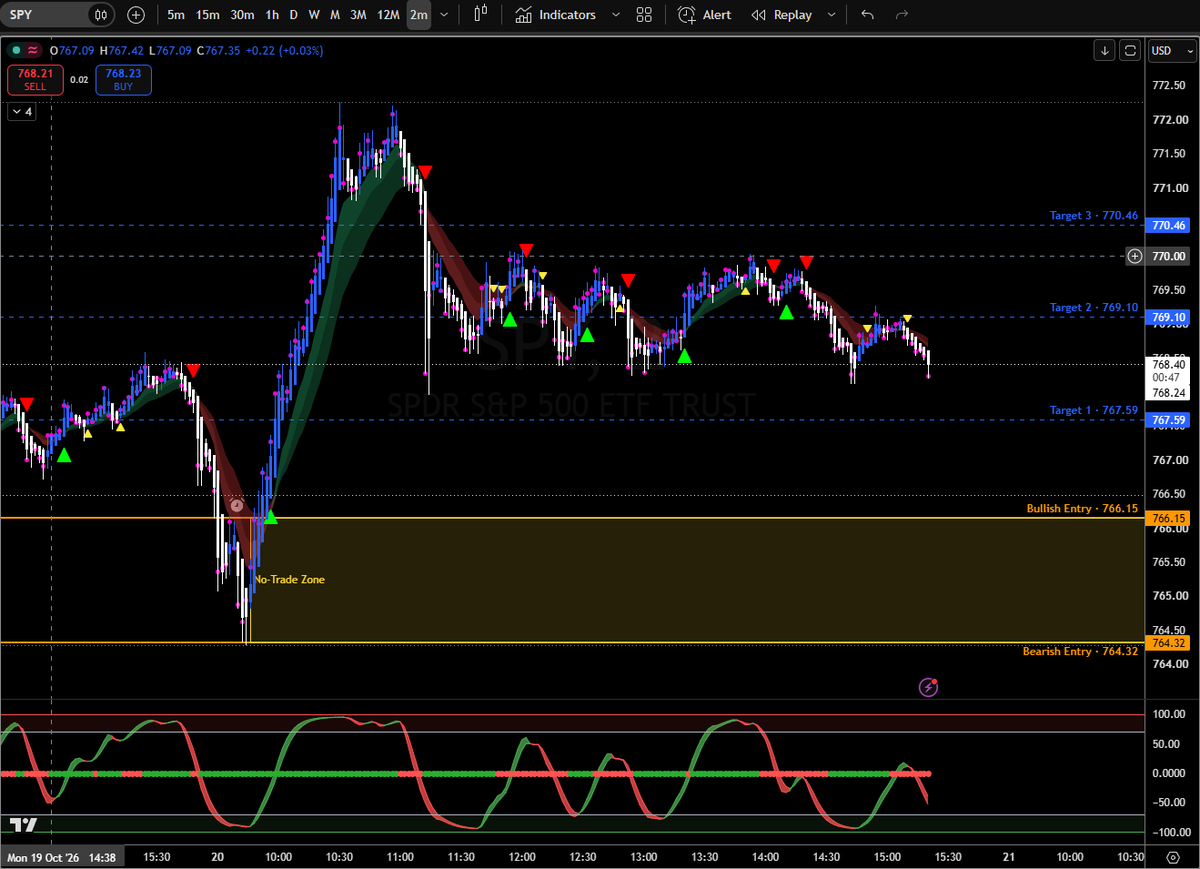
How I traded $SPY this morning with clear levels mapped straight to @tradingview using FINN EZPZ AI connector. Hit the SPXW261020C7715 from $8 to $20.
The Plan:
🟡 No-Trade Zone: $764.32 – $766.15 (stayed sidelined inside the chop)
🟢 Bullish Trigger: Break above $766.15 (ORH)
The Result: Broke $766.15 cleanly and ran straight through all 3 targets:
🎯 T1: $767.59
🎯 T2: $769.10
🎯 T3: $770.46 (Top of the day!)
No guessing. Just prompt, plot, and execute.
Check out the AI connector: https://t.co/lBT5EQvGUY
#SPY #DayTrading #TradingView #AITrading #StockMarket
@townrunna@AnDan_23 I usually pull my levels around 9:45 AM EST. I don't trade in the first 15 minutes and like the 0DTE and any dark pools to build up.
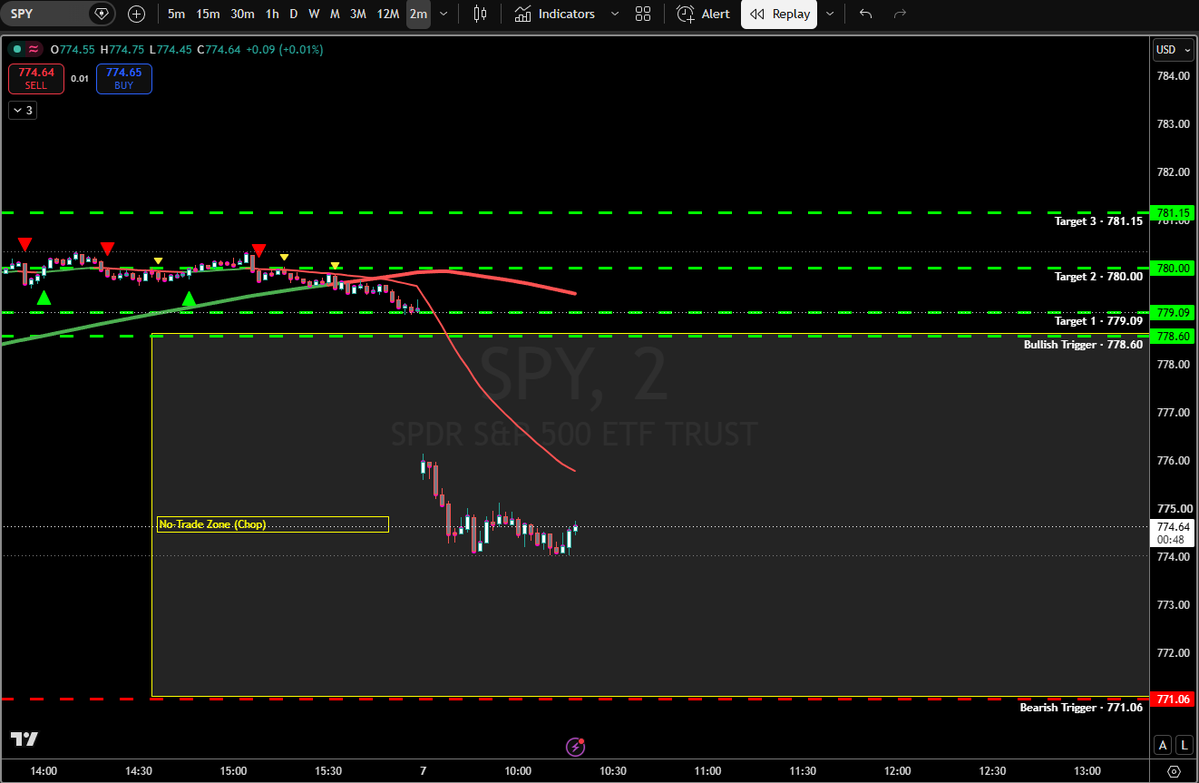
https://t.co/lXlpGTNGP4. FINN AI response: I have analyzed SPY and marked up the trade plan on your chart with thick (3x), price-labeled levels and the yellow "No-Trade Zone" highlight.
SPY: Intraday Trade Plan
Current Price: $774.53 · Bias: 🟢 Bullish (Wait) · Entry Status: WAIT
The market is in a significant tug-of-war this morning. While the long-term trend (EMA stack) is bullish and we have $3.5M in Bullish Dark Pool prints, the EZPZ Intraday Regime is -38 (BEARISH). This conflict is why the No-Trade Zone is so wide—the market is currently pinned between the $775 Put Wall and the $775 Max Pain.
🟢 Bullish Path (Green Lines)
* Trigger: $778.05 (0-Day Expected Move High). A break above this level confirms the "dip" is over and the bullish long-term trend is resuming.
* Target 1: $779.09 (Previous Day Close / Gamma Flip Resistance)
* Target 2: $780.00 (0-Day Call Wall / Psychology)
* Target 3: $781.15 (Daily R1 Pivot / 1-Day Call Wall)
🔴 Bearish Path (Red Lines)
* Trigger: $770.85 (0-Day Expected Move Low). Losing this level confirms the bearish intraday regime is taking full control.
* Target 1: $768.68 (1 Std Dev Support / 9-Day Moving Average)
* Target 2: $767.20 (2-Day Expected Move Low)
* Target 3: $765.90 (50-Day Moving Average / Pivot S2)
🟡 No-Trade Zone (Yellow Highlight)
* Range: $770.85 – $778.05
* Logic: This is the 0-Day Expected Move range. Price is currently oscillating near the middle of this zone ($774.50). Trading inside this yellow cloud is high-risk "chop" where premiums are likely to decay without a clear directional move.
> Overall Market Read: We are in a "show me" market for SPY. The bearish regime score warns against chasing the dip here, while the dark pool prints provide a floor. Wait for a clean exit from the yellow zone before scaling into a directional trade. Not Financial Advice NFA.
Now, AI onboarding will customize your EZPZ experience and organize your dashboard around the way you trade. Try it. New sign-ups will also go through AI onboarding to identify the best package, tools, and setup for their individual needs. 😍
https://t.co/CcM0x2vLhm
https://t.co/lXlpGTNGP4. FINN AI response: I have analyzed SPY and marked up the trade plan on your chart with thick (3x), price-labeled levels and the yellow "No-Trade Zone" highlight.
SPY: Intraday Trade Plan
Current Price: $774.53 · Bias: 🟢 Bullish (Wait) · Entry Status: WAIT
The market is in a significant tug-of-war this morning. While the long-term trend (EMA stack) is bullish and we have $3.5M in Bullish Dark Pool prints, the EZPZ Intraday Regime is -38 (BEARISH). This conflict is why the No-Trade Zone is so wide—the market is currently pinned between the $775 Put Wall and the $775 Max Pain.
🟢 Bullish Path (Green Lines)
* Trigger: $778.05 (0-Day Expected Move High). A break above this level confirms the "dip" is over and the bullish long-term trend is resuming.
* Target 1: $779.09 (Previous Day Close / Gamma Flip Resistance)
* Target 2: $780.00 (0-Day Call Wall / Psychology)
* Target 3: $781.15 (Daily R1 Pivot / 1-Day Call Wall)
🔴 Bearish Path (Red Lines)
* Trigger: $770.85 (0-Day Expected Move Low). Losing this level confirms the bearish intraday regime is taking full control.
* Target 1: $768.68 (1 Std Dev Support / 9-Day Moving Average)
* Target 2: $767.20 (2-Day Expected Move Low)
* Target 3: $765.90 (50-Day Moving Average / Pivot S2)
🟡 No-Trade Zone (Yellow Highlight)
* Range: $770.85 – $778.05
* Logic: This is the 0-Day Expected Move range. Price is currently oscillating near the middle of this zone ($774.50). Trading inside this yellow cloud is high-risk "chop" where premiums are likely to decay without a clear directional move.
> Overall Market Read: We are in a "show me" market for SPY. The bearish regime score warns against chasing the dip here, while the dark pool prints provide a floor. Wait for a clean exit from the yellow zone before scaling into a directional trade. Not Financial Advice NFA.
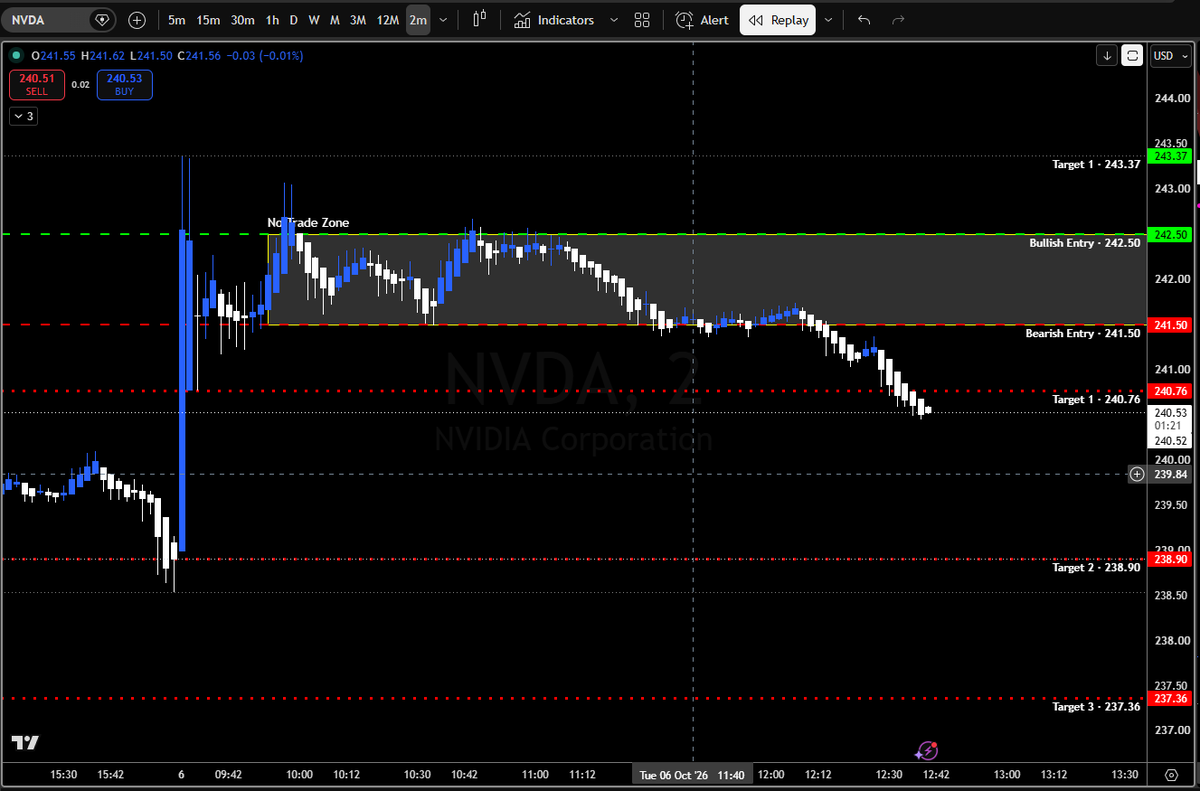
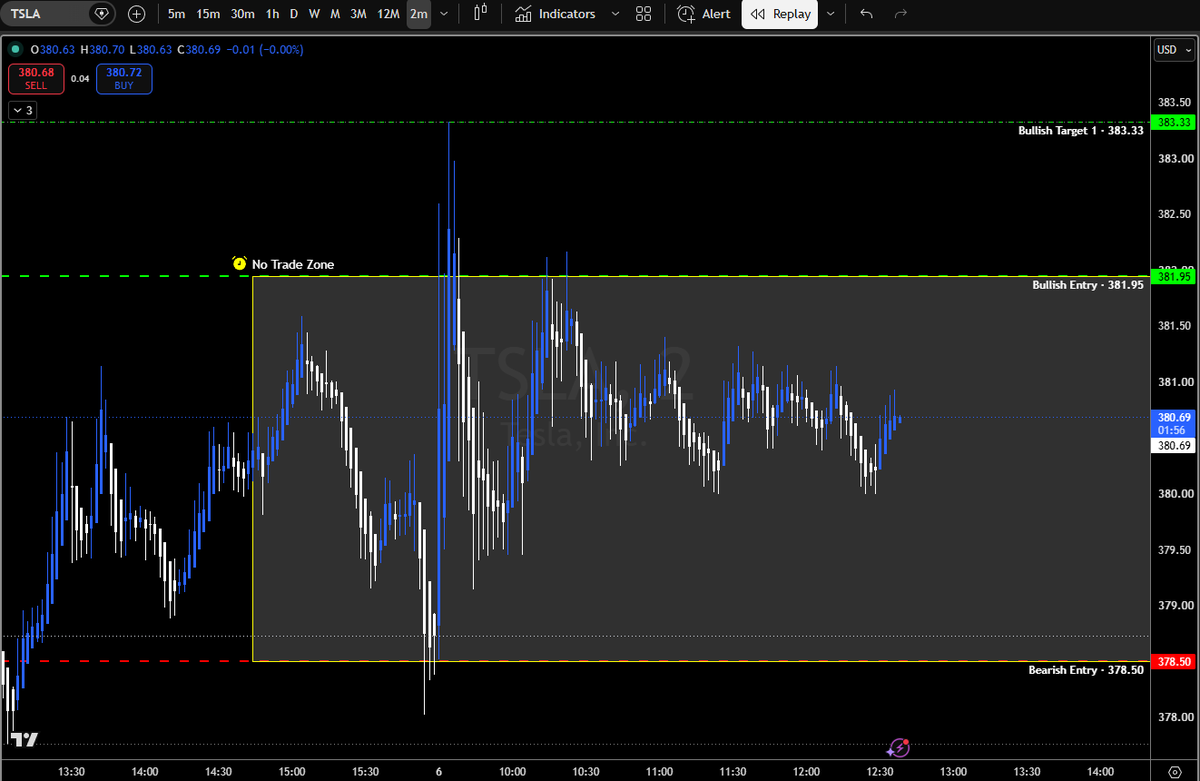
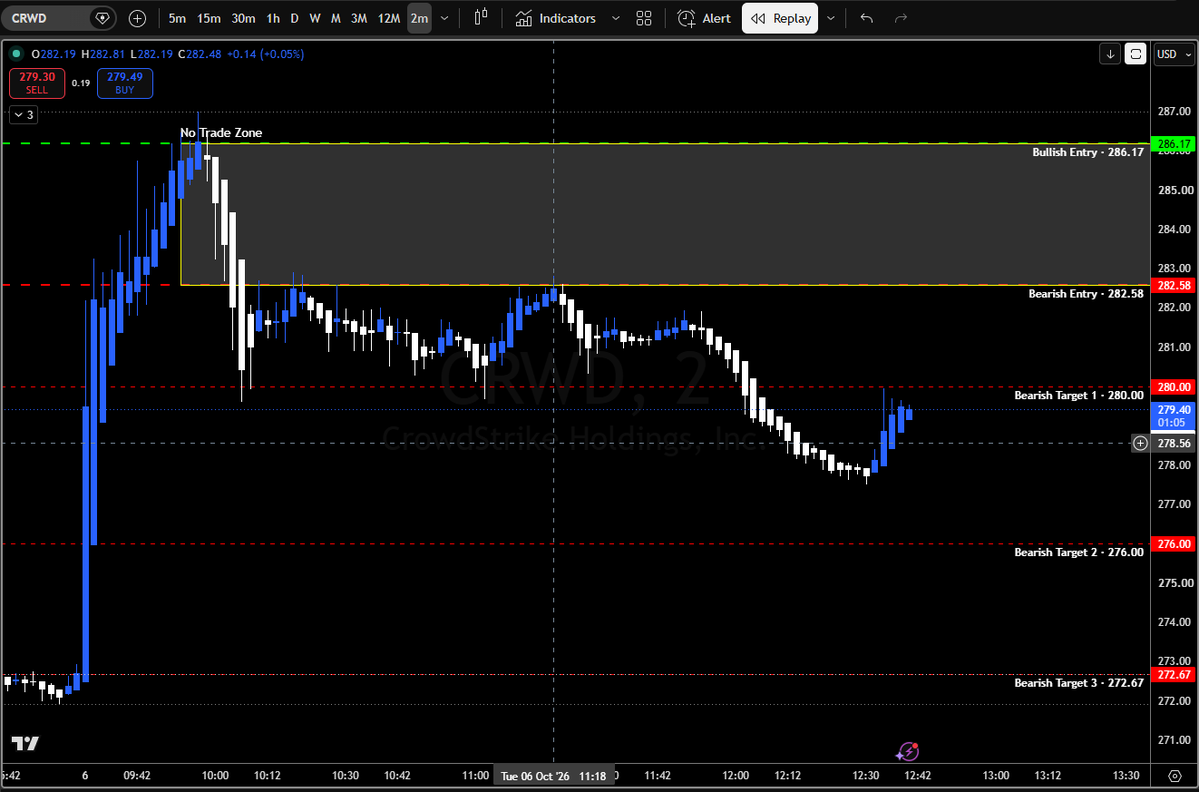
$TSLA $NVDA $CRWD Again https://t.co/lXlpGTNGP4 FINN trade plans executed at 9:45. Look how they played out. The best no trade is TSLA, been chopping in the NO TRADE ZONE all day. NFA