Welcome to https://t.co/WpIP8UuRwN
Check out the season-long grid. Optimize your strategy for your pool’s rules and how many tickets you’re running. Get access to the engine powered by live Vegas spreads and AI insights that went all the way to the end last year.
Sunday’s safest picks in Vegas:
Jaguars 75.9%, on 3% of entries
Texans 75.4%, on 13%
Bengals 73.9%, on 23%
The Jaguars kick off at 9:30am ET, so lock your pick before you sleep in. Check out more at https://t.co/zfbo83I0nl
Thursday night took out nearly half the survivor field.
The Cowboys were on 48% of public entries. They were 80.8% to win in Vegas as 9.5-point favorites. The Buccaneers won.
Still alive? A big share of your pool may already be gone.
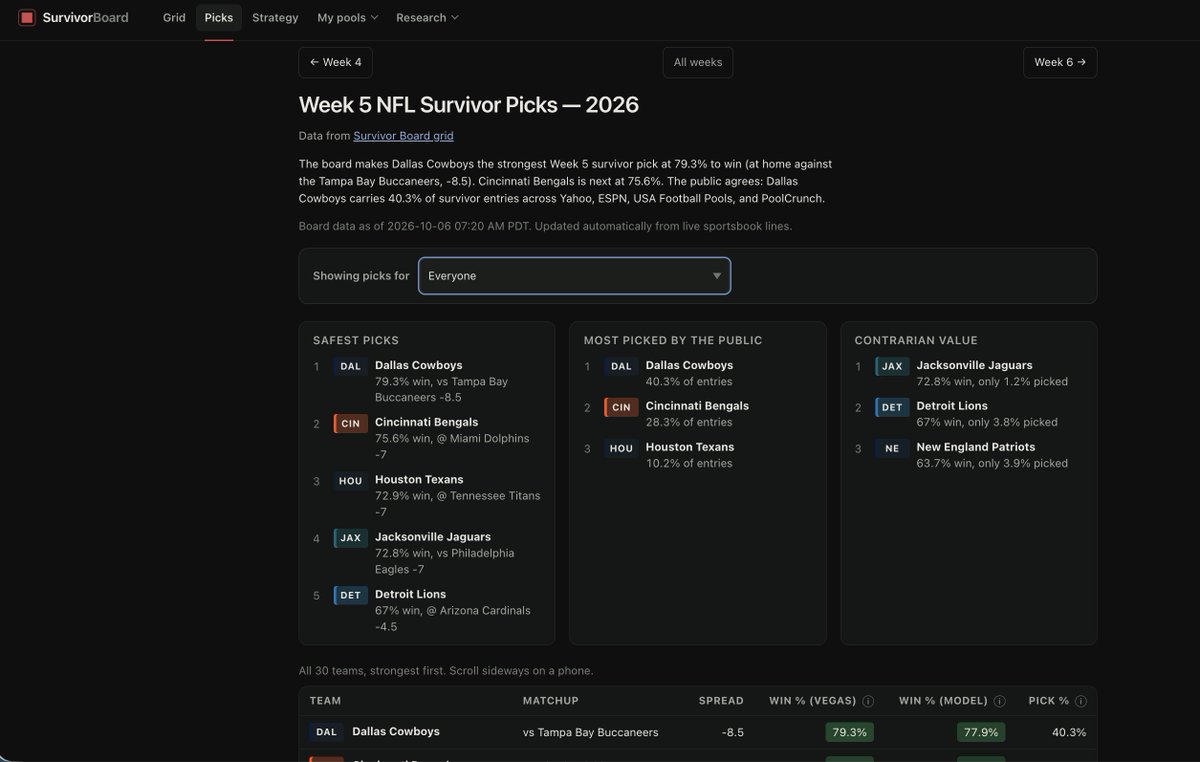
Here's the Week 5 Survivor breakdown by vegas odds. Got your own pool? Add it with its rules and rebuys, and this page shows picks for it.
Set your risk: save strong teams for later, or take the best pick now.
Several entries? The engine spreads them across teams, so one upset can't sink them all.
@McDonaldsXBT Texans went from -3.5 to -7 since the preseason lookahead, so that is definitely something to pay attention to. Our model likes Texans a bit more than Vegaslikes them, at 78.7%. Only 10% of entries are on them. Feel free to check us out at https://t.co/zfbo83I0nl
Week 5 survivor: the Cowboys and Bengals carry 69% of public entries.
Our board's top pick is the Texans at 78.7%. Only 10% of entries are on them.
The Jaguars are 75.7% to win with 1% picked, and have no other week at 70% or better all season.
https://t.co/vazNwkMwB4
@AndyMSFW 8/10 entries should be min or baltimore this week. Check us out for better alternatives for the week at https://t.co/zfbo83I0nl, especially if you’re managing multiple entries in a competition and want to spread risk!
Does your grid rely on stale Vegas data? Is ARI still dogs against LV w17? NYJ at MIA on w12? If your grid thinks that Miami can be the favorite at any point, it is wrong. We account for stale Vegas inputs, and fix it with an FPI blend on our grid.
https://t.co/GpkQkl4U0l
Got fooled by the If man? Maybe you thought that Saleh is a decent coach? Regardless of what got you on week 1, if you are joining any new contest starting this week, check us out! Our engine will give you the optimal strategy, whichever week your contest starts!
We are joining the Splash $100K NFL Survivor Week 2 with 2 tickets, and we will be publishing the engine's results weekly, as always
Are you still relying on public data? Our engine's pick share % predictions are much better than any public data, proven after Week 1. A 5$ plan gets you this data for the whole season!
Circa Survivor, 25,017 entries. 0.73 vs 1.37 public.
Best call was the Chargers against Arizona. I had LAC at 30.3%, Circa's field played it at 30.3%, public data said 27.6%. Dead on a team that was almost a third of the pool. Jacksonville was the bigger gap in absolute terms, 33.1% projected against 32.5% actual while public sat at 23.3%, so public was off by more than nine points on the single most popular pick in the contest.
BetOnline, 32,574 entries. 0.86 vs 0.94 public.
Jacksonville against Cleveland. I had 25.6%, actual was 25.9%, public had 23.3%. Three tenths of a point on the chalkiest pick of the week. BetOnline's field is notably less concentrated than Circa's on the same slate, 25.9% vs 32.5% on the same team, and one national number cannot express that.
The Wave, 22,223 entries. 1.19 vs 1.39 public.
Philadelphia against Washington. I had 4.3%, actual 4.6%, public 3.3%. Small share, but that's the band where being wrong costs you, because a team you think is 3% and is really 5% changes your leverage math more than a percentage point on the chalk does.
The pattern in all three is the same. Public data is fine on shape and wrong on level, because it's averaging fields with very different concentration. Circa chalks up harder than the national number, BetOnline spreads out more, and the small sharp pools are off it worst of all.
Where I was wrong: Vegas. I projected 1.6% and they came in 5% to 9% in six of eight pools. Public had 4.6% and beat me on that team in every pool. No good explanation yet.
One week of data, so treat it as one week of data. I'll post Week 2. Numbers are on my site if you want to pull them apart.
It looks like you are using a stale grid populated with data from preseason. Vegas data is the correct approach for the upcoming 1-2 weeks, but the lines dont move after that, leaving you with stale data.
Two simple sanity checks: Is MIA still favorites in w12 versus NYJ? How about ARI at home vs LV in w17, are they still the underdogs?
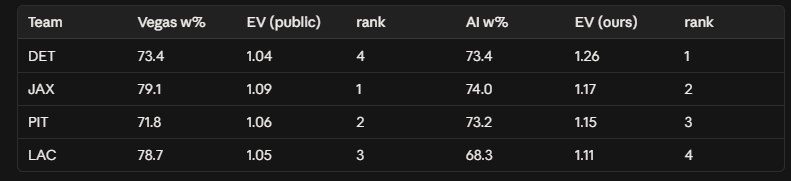
How does this play into your portfolio allocation? If you allocated your tickets into three different teams, one team you picked was probably Chargers. You could have avoided the if man curse using our custom pick share calculations:
When playing with multiple picks, Survivor becomes a resource allocation task. One critical aspect of resource allocation is calculating the EV of each pick accurately. Converting spreads to winning percentages (an applying your secret sauce on top) is easy, but how about the pick shares of your pool?
A lot of tools out there use the generic pick percentages from major public leagues like ESPN, Yahoo, and USA Football.
At https://t.co/eCxI3HFWs5, we calculate pick percentages based on your pool's historical pick data. We can derive it from your week 1 results, or even better, from your previous years results!
Ensure you are getting the best EV data possible with Survivor Board!
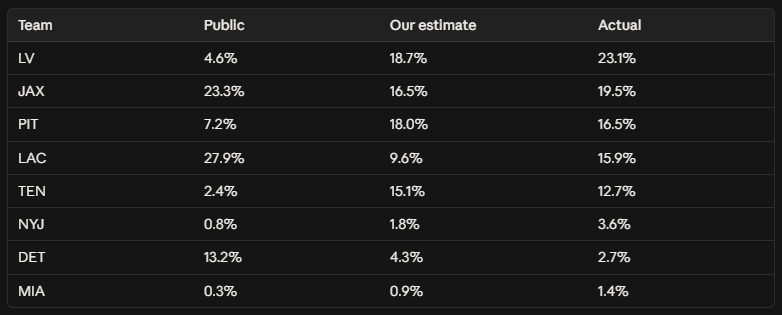
Example 1: Public Pick Shares % vs our rebuy poll
It is expected to see a lot of "burns" during the rebuy weeks. Our EV calculations account for that. Here is the first week's estimates based on historical data, compared to public pick shares:
@rbilabronze@atropos_gg In our tool, you definitely can! Once you enter your league's w1 results, we will auto-calculate the best contrarian fit for your league! We also have the popular pools already calculated, come check us out at https://t.co/GpkQkl4U0l