Under-slept and over-caffeinated filthy casual. Feminist. Word Nerd. Web Developer. Craft Beer & Board Games. She/They. I stole this from a spambot. 1312
It’s important that you understand what happened last night.
Last night, Stephen Colbert interviewed Democratic Texas Senate candidate James Talarico, a candidate who, by all accounts, is on track in the polls to flip Texas blue.
In response, Trump’s FCC reportedly threatened CBS if the interview aired.
CBS caved and pulled the segment, citing “financial reasons.”
In modern American history, no president has been more hostile to free speech than Donald Trump.
But censorship always backfires.
Here’s the full segment Trump didn’t want you to see.
the thing about abusers is that they're extremely good at masking themselves as totally normal people so that they can take advantage of social opinion to get away with their abuse. they hide in plain sight and won't target people who can suss out their shit; they choose victims
PMC COVID-19 Forecasting Model, Oct 28, 2024
Comparable transmission to last week, as is the norm when bottoming out on a "lull."
🔹1 in 123 actively infectious
🔹Higher transmission than during 42% of the pandemic
🔹Nearly 3 million weekly infections
Every indication is that the 10th wave is on the way. I expect to see levels qualitatively higher next week. If lucky, that could be another 1-2 weeks off. However, based on the WastewaterSCAN and Walgreens data, I doubt we're so lucky.
I'll walk you through some of the main dashboards I track regularly.
1) CDC: They post wastewater data on Fridays with a 7-day reporting lag. Note that because their data are stale (10 days old as of today), our stats for "today" are always a forecasts ahead of their raw data. The CDC posts high-quality data. They normalize them well to facilitate year-over-year comparisons that correlate near-perfectly with estimates of transmission as well as other indicators of transmission. Their reporting lag and retroactive corrections to real-time data are the main challenges. It gives you a reasonable picture of where things were 1-2 weeks ago. Their data show flat transmission, which is why when one carries the forecast forward, you see an increase on the way, as the lull ends. That assumes "normal" shapes of waves and lulls and that transmission picks up "as usual" this time of year. It does not factor in year-over-year atypical variation, such as by changes in mitigation policies.
https://t.co/HmuYLFSPyG
2) Biobot: Biobot reports wastewater data, often on Fridays and with about a 9-day average lag (so 12 days as of today). When estimating case levels from CDC and Biobot, we get near-identical estimates. Sometimes people worry about whether one source or another is experiencing "drift" (bias toward higher or lower levels), and we don't see evidence of that. Even the past 60 days, the correlation between case estimates derived from Biobot and CDC are r=.95, near perfect. More simply, when I graph the lines, they are so on top of each other, it's hard to see them both, so it's not as though CDC data lead to overestimates or underestimates of cases. We sunsetted Biobot from our current case estimation model when they experienced an unexplained 3-week reporting delay. However, their reporting has been fine of late, and we're likely to reintegrate them into the model. That will help if the CDC runs into a reporting gap in the winter.
https://t.co/HPYjQA6eBG
(scroll to the bottom and click Latest Report)
3) Walgreens: They post on Monday and have only a 1 day lag at that time. However, consider the lag more like 4-5 days since it takes time for people to get Covid, realize they are sick, and go get tested. Also, it's a positivity ratio, so it's affected by levels of Covid circulating AND levels of other illness circulating that also lead people to go test. It's good to look at number of positive cases, in addition to just the positivity ratio, or note that one should mentally inflate the size of winter waves (or deflate the size of their summer waves) so account for non-Covid illness circulating. Next Monday, we will probably see an uptick at Walgreens, but I wouldn't be surprised if it takes another week given the infection-to-testing time lag. It's as flat as flat can be, consistent with the existing lull.
https://t.co/ZyZ8sV5I1D
4) WastewaterSCAN: They update frequently, but in my experience, the data within the past 48 hours bounce around a lot and can lead people to jump to conclusions. In my experience, their data are very solid after 9-13 days. So, it's good for getting a quicker clue as to what's happening, but you have to take it with more of a grain of salt. Also, they don't normalize the data in a way that facilitates year-over-year comparisons very well, so there is a drift toward apparently larger and larger waves. Between the CDC's site and WWS, most can find some useful local/regional data.
https://t.co/mC2CXjCt51
5) Iowa COVID-19 Tracker: @amethystarlight compiles different data sources very well. It's nice to see everything in one place, as opposed to with the CDC site where you have to click on so many different drop downs. You can see several states already going up, though many still headed down (though remember the reporting lags from the underlying sources).
https://t.co/zL9ynFWlPh
6) World Health Network: They have a wastewater-derived case estimation similar to our own. However, they are also branching out to add additional countries. I see a graph for Germany that is new to me. @jlerollblues can tell you more about what's on the way.
https://t.co/XMSIsIuiT3
7) COVID-19 Resources Canada: @MoriartyLab runs a forecast for Canada. It's presently showing much higher levels of transmission than in the U.S. Her Tweets provide an excellent snapshot of the picture. Non-Twitter users can also monitor current data on their website.
https://t.co/2YC0UBS0WX
8) UKHSA: They report on various surveillance statistics. Last winter, they had a testing-based surveillance program that was impeccable and tracked closely with the PMC (U.S.) and Moriarty (Canada) estimates of transmission.
https://t.co/4xFdVC0aCB
Hopefully you found that review helpful.
For those unfamiliar with the PMC model, find full weekly reports for the past 14+ months at https://t.co/xmDnq5NN8N
The models combine data from IHME, Biobot, and CDC to use wastewater to estimate case levels (r = .93 to .96) and forecast levels the next month based on typical (median) levels for that date and recent patterns of changes in transmission the past 4 weeks.
Our work has been cited in top scientific journals and media outlets, which are fully sourced in a detailed technical appendix at https://t.co/rO6J6BMfE9
Examples include JAMA Onc, JAMA-NO, BMC Public Health, Time, People, TODAY, the Washington Post, the Institute for New Economic Thinking, Salon, Forbes, the New Republic, Fox, CBS, and NBC. See pgs 10-11 at the above link.
The Republican imagination must be an interesting place! Time for facts.
I'm a small family farmer- just like 89.7% of North Carolina's farms. I'm on a first-name basis with their situation.
If I'm not a "real farmer," neither are most of the farmers in North Carolina.
Look beyond the result of today’s GA abortion decision, and you can see Fulton County Superior Court Judge Robert McBurney stake out a broader, methodological position, especially in the footnotes. 1/
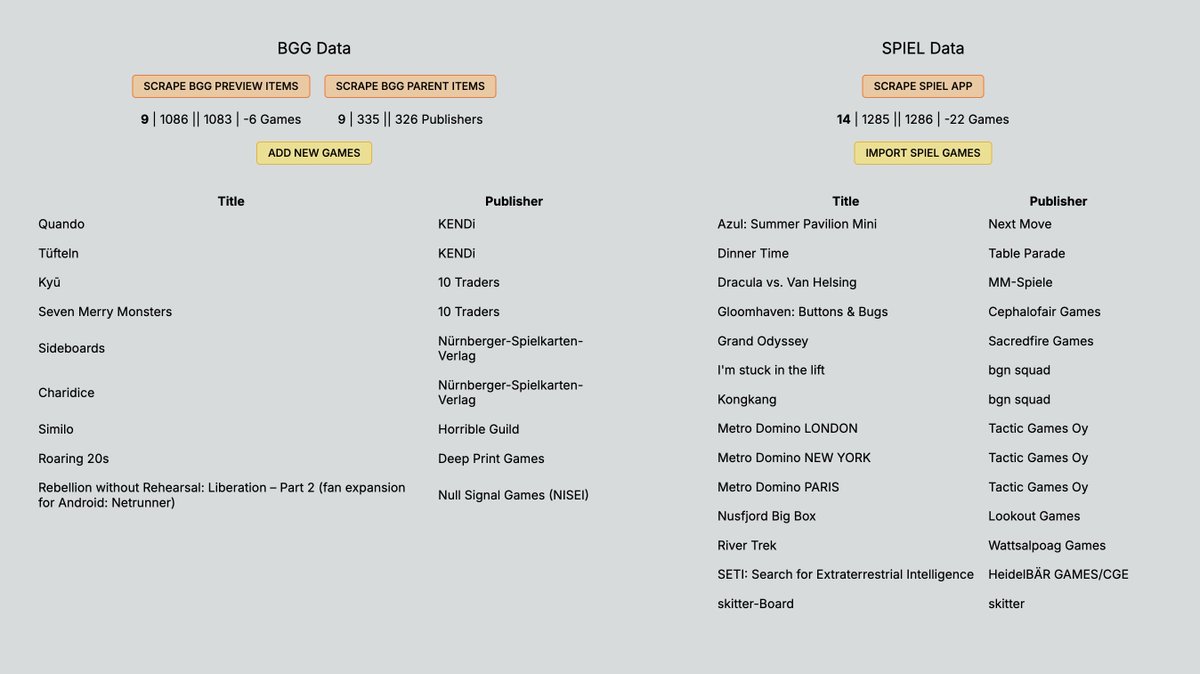
I got too excited last night after solving this that I added the example I was working with to the database, so here's a better one: GeekPreview has the German name, but I know that I'd already added the same game by its English one. how do I choose which one to use? easy —
got another job rejection today, so I'm drowning my sorrows in code like any well-adjusted former "gifted and talented" student would, because if I work harder, people will love me more. that's how it works, right?
anyway, here's what I'm working on: reconciling board game data
the current issue I'm trying to solve is what to do when I've added a SPIEL game to the database, but then the BGG data updates to include that same game. I can't just add the BGG game, because I'll have two entries of the same game, and each source can have different data