✨Highlighting Special Events in Power BI
Quick method to mark promotions and seasonal events directly on a line chart.
Step 1: Build Measures and a Parameter
Create the main measure and an event measure. Add a field parameter to switch events
dynamically and place both fields in the line chart.
Step 2: Configure the Line Layout
Enable markers only for the event parameter so special dates appear clearly while the main line stays intact.
Step 3: Add Error Bars for Vertical Guides
Apply error bars only to the event parameter. Use percentage mode with upper bound 0
percent and lower bound 100 percent. This gives vertical lines without extra DAX.
Step 4: Final Adjustments
Increase marker size and enable labels if needed. Remove unnecessary elements for a clean layout.
#powerbi #report #design #visualization #chart
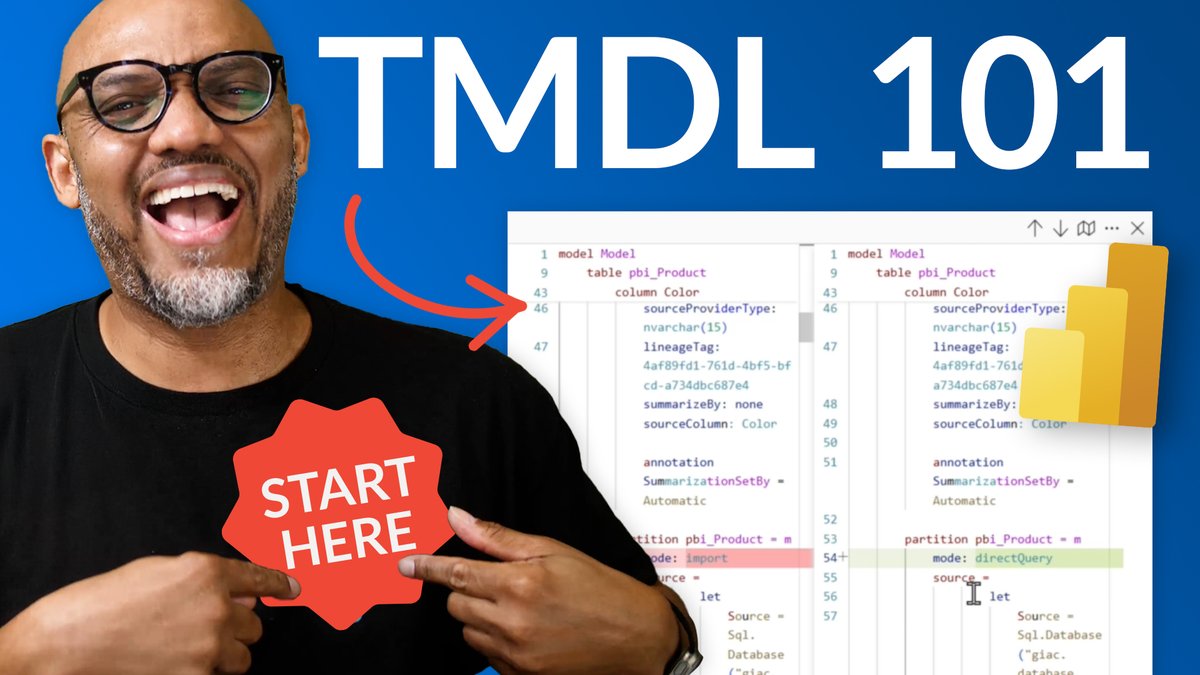
TMDL in #PowerBI lets you edit what the UI can’t: perspectives, modes, and more. 🔥 Dive into the hidden power of your model! #MicrosoftFabric
👉 https://t.co/taFSwhAUcx
Are you finding it difficult to afford expensive paid courses?
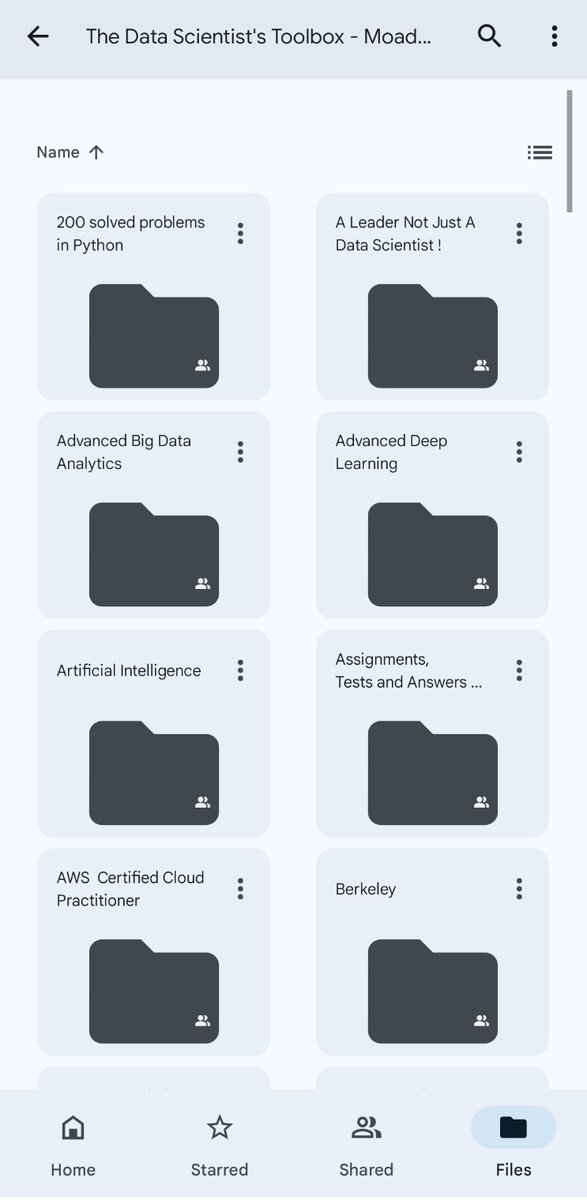
I'm offering you access to 10 complimentary courses 🦑:
1. Artificial Intelligence
2. Machine Learning
3. Cloud Computing
4. Ethical Hacking
5. Data Analytics
6. AWS Certified
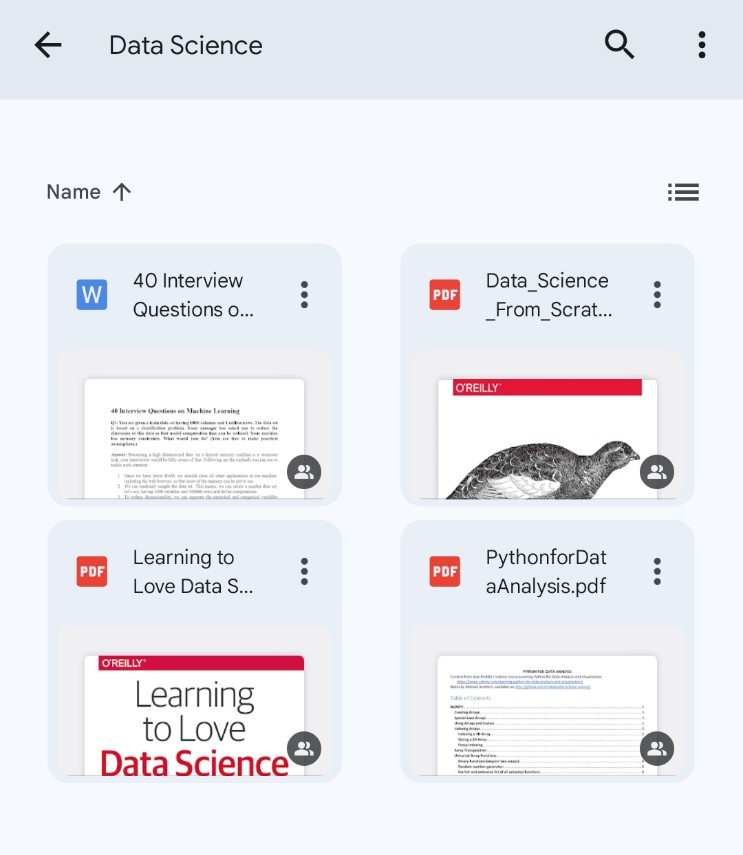
7. Data Science
8. BIG DATA
9. Python
10. MBA
To receive them, simply:
- Like and retweet
- Comment "Free"
- Make sure you're following (so I can send you a direct message)
@clcoding As a beginner in python I like to work on real time projects for my portfolio where I can find the community who are interested in colliding in projects