We've just published our Nigeria Conglomerates Sector Report 2026 — covering all Nigerian Exchange Group (NGX Group)-listed Conglomerate companies across FY2025.
The Nigerian Conglomerates sector delivered a broadly positive FY2025 performance, with aggregate reported revenue of ₦1,145.1 billion and combined post-tax profit of ₦214.9 billion across the six NGX-listed entities in our coverage universe. All six companies remained profitable in the period — a notable achievement given the persistence of structural macroeconomic headwinds including naira depreciation, elevated benchmark interest rates, and energy cost inflation.
Transnational Corporation Plc (TRANSCORP) continued to anchor the sector, contributing 47.5% of aggregate revenue (₦544.1 billion) and the largest share of PAT (₦135.9 billion), underpinned by strong growth in its power generation and hospitality businesses. Custodian Investment Plc delivered an outstanding PAT margin of 30.1%, reflecting the insurance and financial services tilt of its revenue mix, while UACN Plc maintained its position as the sector's leading consumer goods platform with ₦343.4 billion in revenue — bolstered significantly by the consolidation of CHI Limited.
Companies covered: Chellarams Plc, Custodian Investment Plc, John Holt Plc, SCOA Nigeria Plc, Transnational Corporation Plc, and UACN Plc.
Read report here - https://t.co/wkLg6yhPfv
According to CBN semi-annual data highlighted by Nigeria Macro Monitor, ATM transaction values stood at ₦12.2T as of H1 2024.
This data provides crucial context on cash circulation, consumer liquidity preferences, and retail banking trends across the country
Is digital payment growth cooling down in Nigeria? 🇳🇬💳
According to recent data, web and online e-payment transactions reached ₦825.5 Trillion, reflecting a ~24.76% decline between the end of 2023 and H1 2024.
Drop your thoughts in the comments! 👇
We just published our new brief in SysIN Insights' Country Trade Intelligence on Nigeria to Guinea trade flows.
Guinea is a mineral colossus — the world’s largest exporter of bauxite, accounting for 23% of global reserves, with a mining sector generating over 90% of national exports and 21% of GDP in 2022 (IMF). Nigeria is West Africa’s largest economy. Yet total bilateral goods trade averaged under $10m annually across 2021–2024.
Tobacco anchors Nigerian exports in every year — and almost nothing else does. Nigerian exports to Guinea ranged from $2.4m (2024) to $20.2m (2022 peak), with Tobacco & Substitutes present in all four years as the dominant or sole significant export. In 2021, tobacco accounted for $7.8m of $8.2m total exports (95%). The 2022 peak of $20.2m was driven by a $7.5m Miscellaneous Metal Products entry that did not recur, alongside tobacco at $11m. By 2023 and 2024, exports had contracted to $3.3m and $2.4m respectively.
There was an import anomaly in 2021, $11m in mineral fuels from Guinea that never recurred. Guinea’s exports to Nigeria were $11.1m in 2021, entirely dominated by a single entry: Mineral Fuels at $11m. Guinea has no significant petroleum production capacity — its economy is built on bauxite, gold, and iron ore, not hydrocarbons. This fuel entry is almost certainly a transit or data reclassification event and should not be treated as a structural bilateral flow. In 2022, 2023, and 2024, Guinea’s exports to Nigeria fell to $379k, $240k, and $58k respectively — trace quantities of machinery, electrical goods, wood, and used textiles with no commercial significance.
The structural gap includes the reality that Guinea exports nothing Nigeria buys at scale, and Nigeria exports nothing Guinea cannot source closer or cheaper. Guinea’s $25 bn economy is dominated by extractive commodity exports to China and industrial buyers (bauxite, gold, iron ore) — none of which Nigeria imports. Nigeria’s industrial and consumer goods exports (tobacco, cement, plastics, beverages, machinery) are categories where Guinea sources supply from cheaper Asian suppliers, regional French-market distributors, or its informal economy. The result is a bilateral relationship that is formal but commercial vanishingly thin.
Read the report online - https://t.co/3Rm7BZPw1V
We just published our new brief in SysIN Insights' Country Trade Intelligence on Nigeria to Togo trade flows.
The Nigeria–Togo bilateral trade corridor is defined by a circular energy economy, a deep transit-hub relationship. In 2021 and 2022, Nigeria exported $441m–$668m in mineral fuels to Togo, generating comfortable surpluses of $470.6m and $708.8m respectively. In 2023, Nigerian fuel exports to Togo collapsed by 87% to $87.3m — while Togo simultaneously exported $111.4m in mineral fuels back to Nigeria. The result: a near-zero $7.7m surplus in 2023. In 2024, the corridor snapped back to a $655.6m Nigerian export with a $633.6m surplus.
The energy paradox: crude flows west, refined products flow east — and then reverse. Togo purchases crude petroleum worth approximately $498m annually (OEC, 2024 data), primarily from Nigeria, which it processes at the STIR refinery in Lomé (opened 1978, producing refined petroleum for domestic use and export). OEC confirms Nigeria is Togo’s third-largest import source at $662m in 2024, with crude petroleum as the dominant product. In 2023, Togo’s refinery output appears to have generated a significant reverse fuel flow of $111.4m in refined products exported back to Nigeria — a plausible consequence of Togo’s position as a refining hub combined with Nigeria’s domestic refined product deficit (pre-Dangote). The 2023 pattern is the clearest expression in this dataset of the West African petroleum circular trade that characterises several bilateral corridors in this region.
Beyond fuel, Togo exports Perfumery & Cosmetics to Nigeria consistently across all four years: $14m (2021), $2.3m (2022), $3.6m (2023), $525k (2024) — though with high volatility. Raw Hides and Skin appear in three of four years at $2.3–4.3m, reflecting Togo’s agro-pastoral export base. On the Nigerian export side, the non-fuel basket is modest but persistent: Aluminium Articles (all 4 years), Salt/Cement (all 4 years), Tobacco (all 4 years), Glass & Glassware (all 4 years), Footwear (all 4 years), and Plastics (multiple years). These are the structural building blocks of the corridor beneath the energy volatility.
The Port of Lomé is the strategic context. Togo’s economy is anchored by the Port of Lomé — the only natural deep-water port in West Africa, ranked 93rd globally in the Lloyd’s List Top 100 Ports 2024, and the only Sub-Saharan African port in that ranking. The port generates approximately 70% of Togo’s GDP and over 75% of national tax revenues. Nigeria is Togo’s third-largest import source. The bilateral trade relationship between Nigeria and Togo is therefore not merely a country-to-country commercial relationship: it is a supply chain relationship between West Africa’s largest oil producer and West Africa’s premier regional logistics hub.
📑 Read the report online - https://t.co/KHbmeqXUtp
A surprising shift in Nigeria–Benin trade emerged in 2024.
While Benin is not a major cereal producer, cereals became one of Nigeria's top imports from Benin, reaching $7.8 million after being virtually non-existent in previous years.
This highlights an important point about regional trade: trade flows don't always reflect where goods are produced; they often reflect where they are routed.
Benin plays a strategic role as a regional transit and re-export hub. The sharp rise in cereal exports to Nigeria likely reflects grain moving through Benin rather than grain grown there. This aligns with the supply chain disruptions that followed Niger's border closure with Benin and the subsequent lifting of ECOWAS sanctions in early 2024.
The data serves as a reminder that understanding trade requires looking beyond the numbers to the geopolitical and logistical dynamics that shape it.
Key takeaway: Sometimes, the biggest story in trade data isn't production; it's the movement of goods through regional supply chains.
#Nigeria #Benin #Trade #RegionalTrade #WestAfrica #EconomicAnalysis #SupplyChains #DataAnalytics #Agriculture #Economics #TradeInsights
Nigeria's freshwater withdrawals remained unchanged at 5.64% between 2021 and 2022.
At first glance, this signals stable use of the country's renewable water resources across households, industry, and agriculture. But stability in water use doesn't necessarily translate into growth in agricultural output.
Our economic mapping suggests that crop production is influenced by several key factors, typically with a 6-month lag:
🌾 Food Prices – Higher prices can encourage farmers to cultivate more land.
💳 Sectoral Credit – Better access to finance supports investment in seeds, fertilizer, and equipment.
💱 Exchange Rate – A weaker Naira raises the cost of imported agricultural inputs, putting pressure on production.
While stable water withdrawals are encouraging from a sustainability perspective, they also suggest there was no significant expansion in water-intensive irrigation or industrial activity during this period.
Key figures:
📊 2021: 5.64%
📊 2022: 5.64%
📈 Change: 0.00%
#Nigeria #Agriculture #WaterResources #EconomicAnalysis #DataInsights #FoodSecurity #Sustainability #EconomicDevelopment
Nigeria saw a massive surge in international financial flows dedicated to solar energy between 2022 and 2023. These investments grew by over 1,100%, shifting from a relatively small baseline to a significant capital inflow.
For the average Nigerian, this trend is a positive signal that global investors are increasingly betting on Nigeria’s renewable energy sector, which could eventually lead to improved power stability and less reliance on expensive generators.
This rapid increase in solar funding matters for the economy because it brings in foreign capital (USD) directly into the energy sector.
While this specific data tracks solar flows, Nigeria’s broader economic health is still heavily tied to Bonny Light, which impacts the government's ability to co-fund infrastructure
We just published our new brief in SysIN Insights' Country Trade Intelligence on Nigeria to Benin trade flows.
The formal BACI data for the Nigeria–Benin bilateral corridor must be read with an explicit caveat that applies to no other bilateral pairing in standard trade statistics: Benin’s economy is structurally built around the entrepôt re-export of goods to Nigeria. The IMF has documented that re-exports and informal exports to Nigeria account for more than 90% of Benin’s total informal trade activity. The World Bank has estimated that 80% of all goods entering Benin are ultimately destined for Nigeria. Brookings Institution research has established that the informal sector represents approximately 70% of Benin’s GDP and 90% of employment. This means that the bilateral flows recorded in OEC BACI formal customs data capture only a thin slice of the actual Nigeria–Benin economic relationship. Any analytical conclusion drawn from the formal data alone will systematically understate the corridor’s true scale and the depth of Benin’s economic dependence on Nigeria.
With that caveat established: the formal data reveals a one-directional, mineral-fuel-anchored supply corridor that grew from $124.2m in Nigerian exports (2021) to a peak of $235.2m (2023) before contracting to $189m (2024). Nigeria has maintained a trade surplus in every year. Mineral fuels dominate the export basket in all four years, ranging from 75% to 88% of total outbound value. Beyond fuel, the corridor has a thin but consistent non-fuel export basket: iron and steel, fertilizers, cars and parts, beverages, machinery, glass, electrical goods, and cereal preparations all appear with meaningful regularity.
Benin’s return flows to Nigeria are modest in formal terms but structurally interesting. Animal or Vegetable Fats, Oils & Waxes (predominantly palm oil and shea butter) is the most persistent import category at $5.1–10.7m annually from 2021 to 2024, reflecting Benin’s agro-industrial processing capacity. Soap and Cleaners, Oil Seeds, and Machinery rotate as secondary imports. A new and analytically significant entry appears in 2024: Mineral Fuels from Benin to Nigeria at $13.3m — plausible given the Port of Cotonou’s role as a petroleum re-export node, and consistent with Benin’s documented role as a fuel smuggling corridor, but requiring verification.
The fertilizer corridor is the most commercially significant non-fuel export story. Fertilizer exports spiked to $46.8m in 2022 before falling to $31.5m (2023) and $13.8m (2024).
📑 Read the report online - https://t.co/DmyaeJsoqO
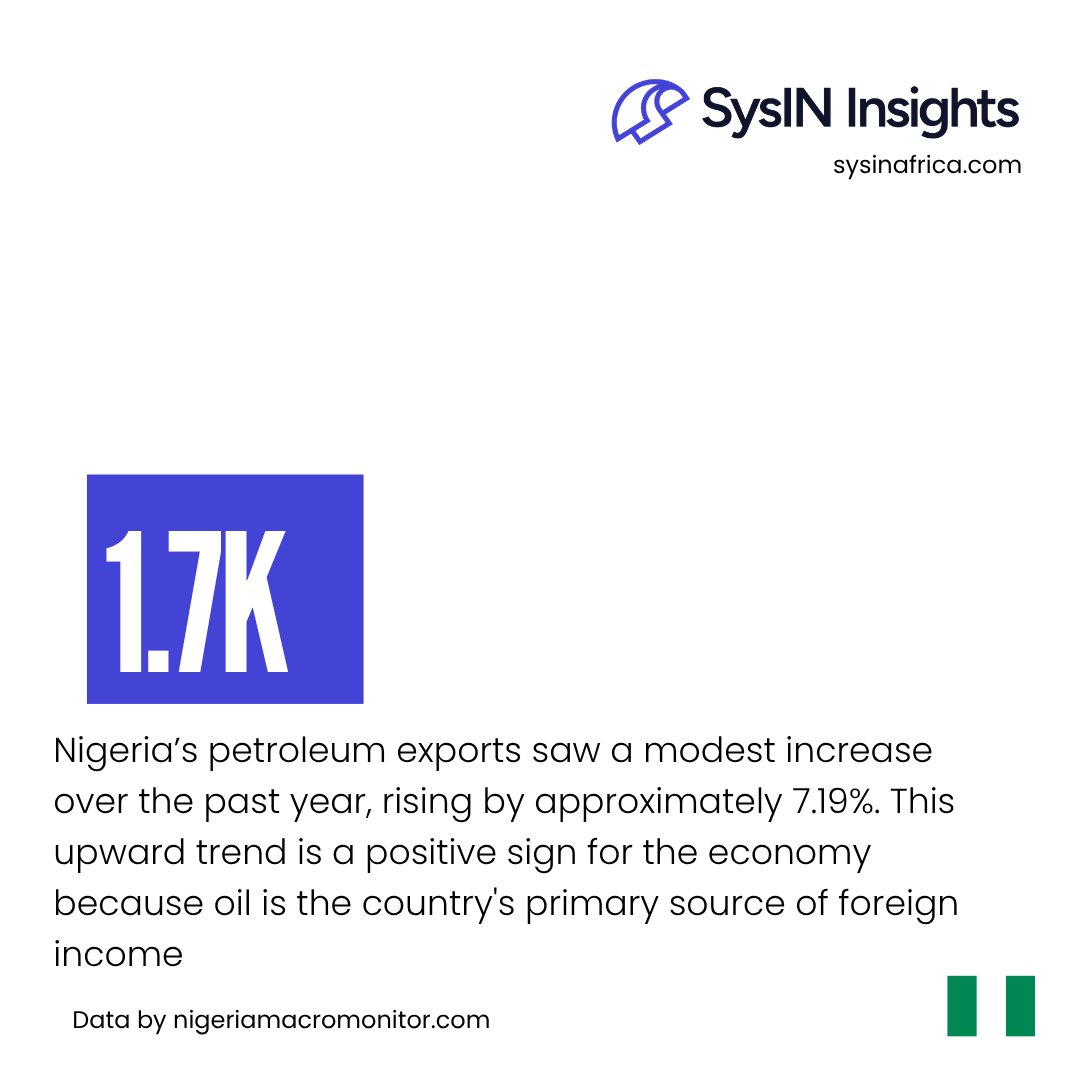
The petroleum export sector exhibits clear upward momentum over the trailing 12-month period, with output expanding by 7.19%.
This absolute increase of 112.34 thousand barrels per day (kbpd) represents a positive shift from the 1.6K floor established in January 2024 to a peak of 1.7K in January 2025.
Given the lack of intermediate volatility (stdev: 0.00), this transition reflects a direct step-up in export capacity rather than a fluctuating recovery.
We just published our new brief in SysIN Insights' Country Trade Intelligence on Nigeria to Senegal trade flows.
The Nigeria–Senegal bilateral trade relationship is small relative to Nigeria's global trade but has grown rapidly and unevenly over 2021–2024, driven almost entirely by refined petroleum flows. Nigerian exports to Senegal rose from $470.6m (2021) to $483.0m (2022), then more than doubled to $1,015.7m (2023), before falling back 54.2% to $464.7m (2024). Mineral Fuels, Oils, Waxes and Distillated Derivatives (HS Ch. 27) drove $957.3m of the 2023 total — 94.3% of that year's exports — up from $396.6m in 2022.
Senegal is a fast-growing but fiscally and politically strained ECOWAS partner. With GDP of approximately $32.3 bn (2024) and among the fastest real GDP growth rates in West Africa (6.9% in 2024, driven by a 160% jump in oil extraction as the offshore Sangomar field came onstream), Senegal is a materially smaller economy than Nigeria but one undergoing acute stress: a 2025 audit revealed billions of dollars in previously undisclosed public debt, pushing the debt-to-GDP ratio above 100% (some estimates cite over 130%), triggering an IMF standoff, successive sovereign downgrades to CCC+, and, in May 2026, the dismissal of Prime Minister Ousmane Sonko by President Bassirou Diomaye Faye over how to resolve the crisis. Unlike Cameroon, Senegal shares ECOWAS and AfCFTA membership with Nigeria — the ECOWAS Trade Liberalisation Scheme applies directly to this corridor — and its historic Casamance separatist conflict reached a landmark peace accord in February 2025, a materially different security trajectory from an active regional conflict.
Read here - https://t.co/W93AvmaE40
Nigeria's hydroelectric power generation from the national grid saw a slight increase between 2022 and 2023.
This growth suggests a steady, albeit modest, expansion in our ability to generate "clean" electricity from water sources like our major dams.
For Nigeria, consistent growth in hydropower is vital because it provides a cheaper and more sustainable alternative to gas-fired power plants, helping to stabilize the national grid.
We just published our new brief in SysIN Insights' Country Trade Intelligence on Nigeria to Côte d'Ivoire trade flows.
The Nigeria–Côte d’Ivoire corridor is the largest, most structurally anchored, and most commercially mature bilateral trade relationship so far in the SysIN Trade brief series. Nigerian exports to Côte d’Ivoire grew from $1.1bn (2021) to $2.4bn (2024) — a 118% increase in four years. The corridor is dominated by mineral fuels and petroleum derivatives on the Nigerian export side, reflecting a structural energy supply relationship between an OPEC oil producer and a West African refining hub with a net crude oil deficit. This is not an episodic flow but the defining feature of the corridor and the commercial relationship around which all else should be understood.
Côte d’Ivoire’s energy import structure explains the corridor. The Société Ivoirienne de Raffinage (SIR) in Abidjan is the only oil refinery in Côte d’Ivoire and holds a statutory monopoly on crude oil importation. SIR sources crude from multiple suppliers — including Nigerian crude — processes it into refined petroleum products, and distributes those products domestically and exports surpluses to the West African subregion. Nigeria is Côte d’Ivoire’s second-largest source of imports globally at $2.4 bn in 2023 (ISS Africa Futures). The bilateral oil trade is not a peripheral commercial relationship; it is a foundational energy supply chain.
Fuel also dominates the import side, but with meaningful diversification. Côte d’Ivoire’s exports to Nigeria are led by Mineral Fuels ($77.9m in 2024, 47.4% of total imports), but the import basket is genuinely diversified: Perfumery & Cosmetics ($29.7m, persistent across all years), Animal and Vegetable Fats and Oils ($18.8m), Miscellaneous Edible Preparations ($11.6m), Soap and Cleaners ($7.5m), Cotton ($3.3m), and Footwear ($2.8m) all appear with meaningful consistency. Côte d’Ivoire is exporting manufactured and agri-processed goods to Nigeria — a reversal of the standard West African bilateral pattern.
The corridor has a paradoxical fuel dynamic. Nigeria — an OPEC crude oil producer — exports mineral fuels to Côte d’Ivoire, which refines crude into products and exports refined petroleum derivatives back to Nigeria. This creates a circular energy trade: crude and petroleum feedstocks flowing west, refined products flowing east. Understanding whether Nigeria’s fuel exports to Côte d’Ivoire are crude, refined products, or LNG is a key analytical question this dataset alone cannot resolve, but the structure is consistent with SIR’s documented procurement of Nigerian crude.
Read the report online - https://t.co/D57uzVpuKz
Visit or contact us - https://t.co/V0T2vgnNRx
Demo the Nigeria Macro Monitor - https://t.co/fWX64ykj7H
#Nigeria #IvoryCoast #WestAfrica #TradeIntelligence #AfCFTA #SysINInsights #NigeriaMacroMonitor
This is a very sharp upward trend, representing a 118.68% increase in just one year. For the Nigerian economy, this rise is important because remittances are a vital source of foreign currency, helping support households and cushion against domestic economic challenges. While this trend is strongly positive, the total increase of 4.76 percentage points highlights how much more central these foreign inflows have become to Nigeria's overall economic activity.
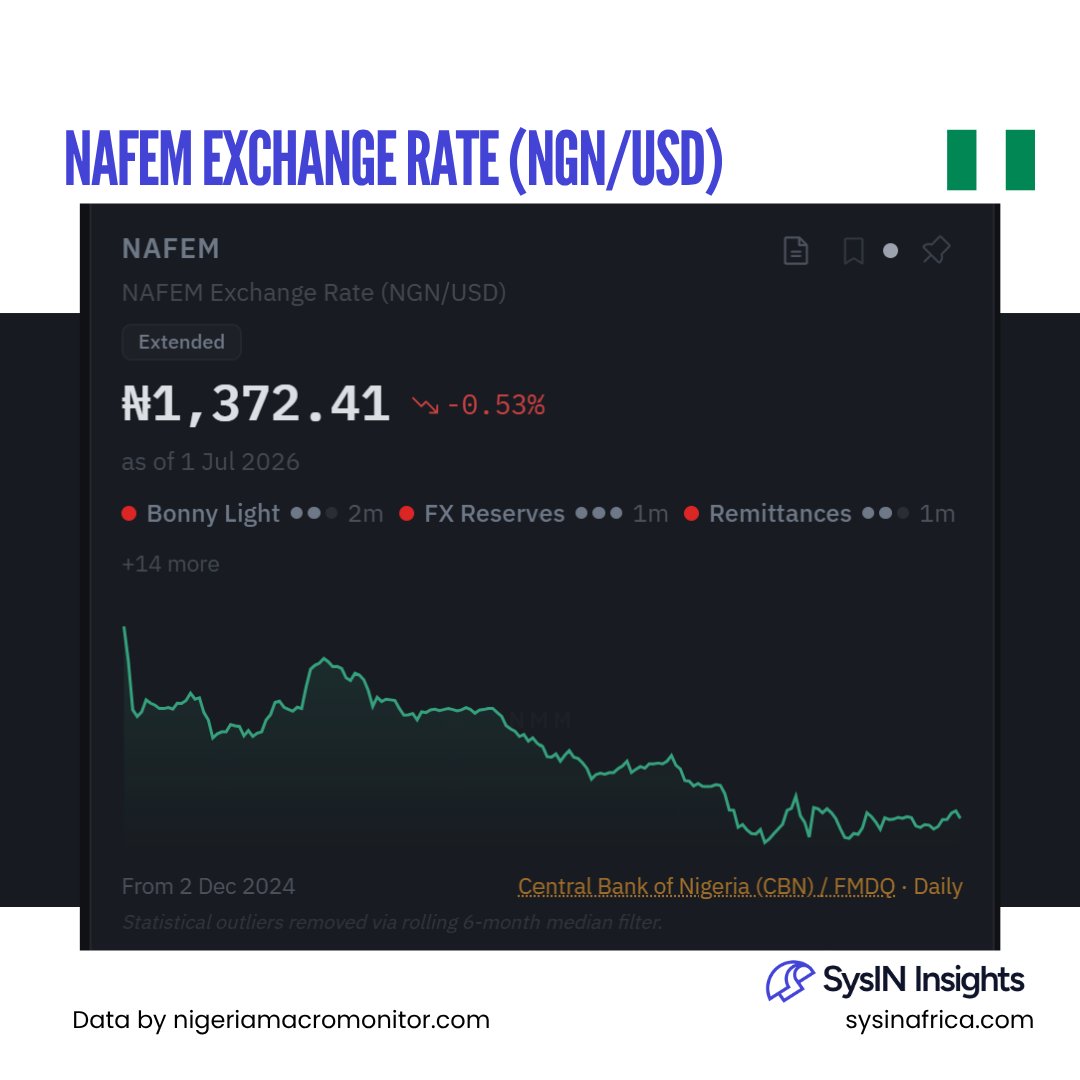
Between July 2025 and July 2026, the Naira showed significant recovery against the US Dollar. The exchange rate moved from ₦1,525.00 to ₦1,372.41, representing a 10.01% appreciation of the Naira. While the first half of the window saw the rate peak at its highest point (₦1,538.45 in August 2025), the second half was characterized by a strengthening Naira, reaching its strongest point at ₦1,335.96 in February 2026.
We just published our new brief in SysIN Insights' Country Trade Intelligence on Nigeria to Ghana trade flows.
The Nigeria-Ghana goods corridor is a positive-surplus corridor for Nigeria, but the review-period signal is weaker than the balance alone suggests. Total bilateral trade fell from $459.4m in 2021 to $192.1m in 2024, a 58.2% contraction driven mainly by a sustained decline in Nigerian exports to Ghana.
Nigeria's exports to Ghana declined from $381.3m in 2021 to $139.3m in 2024, while imports from Ghana moved from $78.1m to $52.8m after peaking at $116.1m in 2023. Nigeria therefore remained in surplus throughout the review period, but the surplus narrowed from $303.2m in 2021 to $46.1m in 2023 before recovering to $86.5m in 2024. The 2024 surplus recovery should not be misread as a stronger corridor. It reflected a sharper fall in Ghana-to-Nigeria imports than in Nigeria-to-Ghana exports. In underlying trade terms, 2024 was still the weakest year in the dataset, with the lowest bilateral trade value and a smaller Nigerian export base.
The export basket reset materially. In 2021, Nigeria's sales to Ghana were shaped by Aircraft and Spacecraft ($125.8m) and Mineral Fuels ($104.7m). By 2024, the corridor was led by Cocoa and Cocoa Preparations ($43.9m), followed by Tobacco ($10.3m), Plastics ($9.9m), Miscellaneous Edible Preparations ($9.4m), Glass ($9.3m),Ships and Floating Structures ($8.5m), Sugars and Confectioneries ($8.0m), Salt/Cement/Lime/Plaster ($7.6m), Electrical Machinery ($5.5m), and Soap/Cleaners ($4.6m).
Ghana's exports to Nigeria were narrower but more stable. Animal or Vegetable Fats and Oils, Cocoa Preparations and Cereal Preparations anchored the flow across most years. In 2024, the top four categories - Cocoa Preparations ($17.2m), Fats and Oils ($13.9m), Mineral Fuels ($9.2m), and Cereal Preparations ($5.2m) - accounted for most of Ghana's visible export basket to Nigeria.
The corridor is therefore best understood as a regional consumer, food-processing and light-industrial trade corridor, not an energy loop. Its next phase depends on whether Nigerian firms can rebuild repeatable exports in processed foods, packaging, plastics, glass, tobacco, confectionery, building inputs and electrical goods while Ghana sustains agri-processed exports into Nigeria.
Read the report online - https://t.co/sKxUficmGy
Visit or contact us - https://t.co/V0T2vgnNRx
Demo the Nigeria Macro Monitor - https://t.co/fWX64ykj7H
#Nigeria #Ghana #WestAfrica #TradeIntelligence #AfCFTA #SysINInsights #NigeriaMacroMonitor
NGX Conglomerates: a strong topline, with profitability still taking shape.
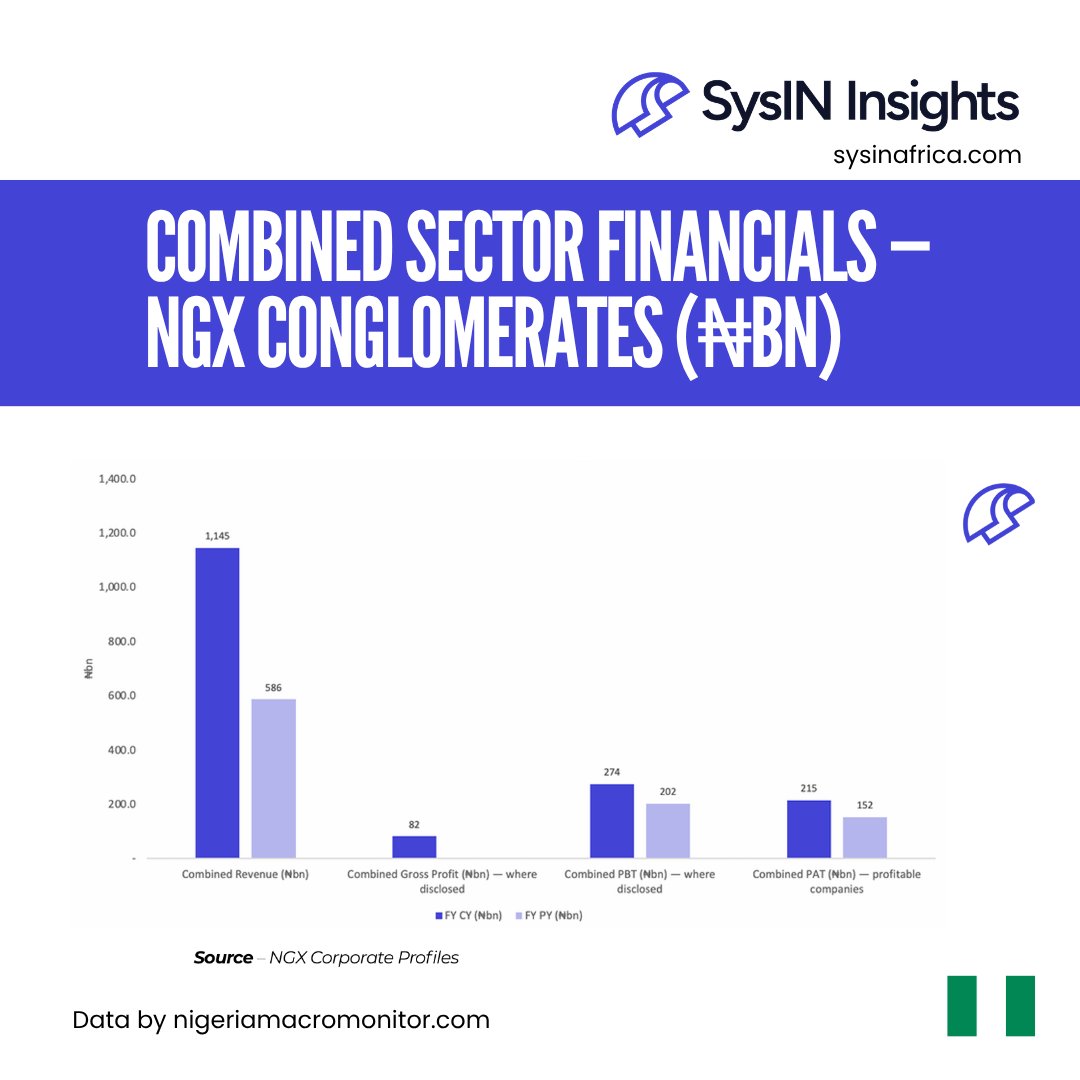
Our latest review of listed conglomerates on the Nigerian Exchange shows combined revenue of ₦1.15tn, up from ₦586bn in the prior year.
Among companies that disclosed the relevant figures, combined profit before tax reached ₦274bn, while profitable companies recorded combined profit after tax of ₦215bn.
These results point to a sector benefiting from stronger scale and earnings momentum, while also highlighting the importance of looking beyond revenue to understand the quality and breadth of profitability.
Note: This analysis covers NGX-listed companies only and should be interpreted within that listed-company context, rather than as a complete view of Nigeria’s broader conglomerates sector.
#NGX #Nigerianeconomy #Conglomerates #Financialanalysis #Capitalmarkets #Marketinsights
We just published our new brief in SysIN Insights' Country Trade Intelligence on Nigeria to Cameroon trade flows.
A high-volume corridor obscured by two anomalies. The Nigeria–Cameroon bilateral trade relationship is substantially larger than the headline figures suggest once its two most distorting data points are correctly contextualised. The 2021 export figure of $580.5m is dominated by a single $522.2m entry in Ships, Boats and Floating Structures — almost certainly a one-off vessel transaction rather than a recurring commercial flow. Stripping this out, the underlying Nigerian export base across 2021–2024 was $58–191m annually. Similarly, the 2024 Cameroon import figure of $1.6m represents a 97.7% single-year collapse from $70.6m in 2023, driven by the complete disappearance of Soap, Cleaners and Candles (HS Ch. 34) — which had driven $15–45m in every prior year.
Ships, salt, and tobacco define the export architecture. Excluding the vessel anomaly, Nigeria’s structural exports to Cameroon are led by Salt, Sulphur, Cement, Lime, Stone and Plaster (Ch. 25), Tobacco and Substitutes (Ch. 24), and Mineral Fuels (Ch. 27) — all present across multiple years. These are supply relationships grounded in Nigeria’s industrial and processing capacity meeting Cameroon’s construction and consumption needs. Machinery (Ch. 84) emerged as the dominant single export in 2023 at $75.3m before collapsing out of 2024’s top products entirely, suggesting an episodic capital goods supply event.
Soap dominates Cameroonian exports to Nigeria, then vanishes. Soap, Cleaners, Candles and Dental Preparations (Ch. 34) was the overwhelmingly dominant Cameroonian export to Nigeria in 2021–2023, rising from $15.8m to $36.4m to $45m over those three years. Its complete absence in the 2024 data is the single most consequential analytical question in the import side of this brief. Whether this represents a supply disruption, a trade routing change, a customs classification shift, or a data reporting gap is unknown and must be resolved.
Cameroon is a significant economy with a complex security environment. With GDP of $51.3 bn (2024), Cameroon is a materially larger trade partner than the AES landlocked Sahel economies. It is also a country operating under two simultaneous armed conflicts — the Anglophone separatist crisis in the North West and South West regions (ongoing since 2017, over 6,500 killed, nearly one million displaced) and the Boko Haram and ISWAP insurgency in the Far North region bordering Nigeria. Both conflicts directly affect the trade corridors through which Nigeria–Cameroon bilateral commerce flows.
Read the report online - https://t.co/2kJpRcIUcU
Visit or contact us - https://t.co/V0T2vgnNRx
Demo the Nigeria Macro Monitor - https://t.co/fWX64ykj7H
#Nigeria #Cameroon #WestAfrica #CentralAfrica #TradeIntelligence #Sahel #AfCFTA #SysINInsights #NigeriaMacroMonitor