PIMCO is out with their secular outlook. They call out private credit / middle-market lending as being especially vulnerable to the "unfolding default cycle".
Full respect to PIMCO - they are highly able credit managers. Buuuut...
1. For now at least, corporate defaults are moving lower, not higher (yes, that could change). BDC non-accruals and PIK are flat in Q1 and the vast majority of the NAV writedowns were due to wider spreads in syndicated loans.
2. PIMCO manages liquid public credit. They are incentivized to poo-poo private credit if they can gather more assets to manage
3. PIMCO has been bearish (cautious, sorry) on private credit for as long as I can remember and here we are with private credit outperforming public credit fairly consistently.
Sure, 2021 underwriting was not the best and losses will happen (hello Medallia). BDCs have already marked down software loans by 3% and IGV has recovered half of its drawdown. Q2 should be a good one for BDCs.
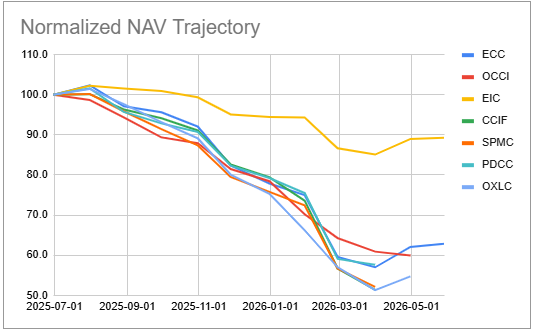
CLO Equity funds have started to report May NAVs and they are marginally higher, at least for $EIC and $ECC. The credit market environment has moved in CLO Equity’s favor. The somewhat nervous credit environment that marginally favors lenders over borrowers means loan refinancings - the killer of CLO Equity over the past year - are much more muted.
At the same time, the two key problems with the sector aren’t going to be resolved. One is the somewhat unpredictable nature of CLO Equity security prices which can move swiftly lower with very little stress in broader markets.
And two, how those downward prices translate into forced deleveraging across the CEFs. Despite some recovery in NAVs over the last two months, most of the sector is still nursing NAV losses of around 40% year-on-year. Even in the best case environment that is not going to be possible to recover from which makes it very hard to have conviction around this asset class. As tactical playthings, however, they are great.
Check out review of BDC $NCDL Q1 numbers. TLDR, NCDL remains an outperformer while trading at a below-median valuation - a combination that's very attractive. We also touch on some of the misconceptions produced by the commentariat slop about the stock.
https://t.co/6m2zqy5YPV
While software ETF $IGV clawed back about 60% of its year-to-date sell-off (and nearly all of it prior to the most recent sell-off that started in June), private credit investors continue asking for their money back.
Blackstone giant private BDC $BCRED as well as Cliffwater’s flagship fund capped redemptions at the usual 5%. Investors tried to pull 17% from the latter. This was above the 14% that investors asked for last quarter.
It’s not clear why everyone is not asking for redemptions. After all, there are lots of solid public BDCs (median public BDC 3Y total NAV return is about 1% below that of $CCLFX) and the median BDC trades at a 24% discount.
In fact, the median valuation-adjusted public BDC has a 3Y total NAV return close to 2% above that of CCLFX. So long as the public BDC sector continues to trade at wide discounts, private BDC redemptions will continue.
BDC $OTF sold $500m of bonds, boosting the issuance from an initial target of $300m. The notes ended up trading with a spread of 2.65% over Treasuries, after tightening from initial price talk of around 3% over Treasuries. This is only a bit higher than the spreads of 2.5% and 2.6% for its two most recent bonds, though higher than the 1.8% spread on its 2028 bond.
The company is benefitting from two dynamics. One, its leverage is on the low side in the BDC sector at 0.85x vs. around 1.2x median level. And two, it allocates primarily to Tech / Software firms and this loan sector has seen spreads widen sharply amid the talk of AI disruption of SaaS businesses.
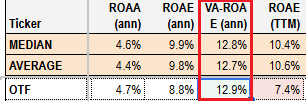
This means OTF can put more capital to work today and its capital is going into a loan sector whose spreads are significantly wider than the average level. Both of these factors add up to a steady boost in NII. Its valuation-adjusted ROE is 12.9% vs. 12.8% median, even before we have seen these two dynamics really kick in.
BDC $FSK announced a $900m 7.5% 2031 bond. The bond will trade OTC and will have the usual make-whole feature where FSK can prepay the bond early. It looks like this is intended to replace the $1bn bond that matured earlier this year. That bond had a 3.4% coupon so with the coupon now doubling on around 12% of the debt, it will be a headwind to NII.
This dynamic, where fixed-coupon bonds are refinanced to higher coupons, has been playing out across the broader sector and, apart from the drop in short-term rates, is one reason why NII has been moving lower.
The company’s leverage finished Q1 at a fairly high level of 1.3x - the highest level in over 5 years. FSK has underperformed this year with a 24% drop vs. around a 6% drop for the median BDC. Credit issues continue to plague the portfolio - the total NAV return in the last year is -9% vs. +6% for the median BDC.
Barings BDC ($BBDC) announced the early termination of its credit support agreement. Recall that when BBDC acquired the assets of Sierra Income Corp the parent also provided $100m of protection against losses in the acquired companies. This was a good deal for BBDC since acquired assets are often pretty dodgy as we have seen from the acquisitions of BDCs like FCRD and BKCC.
The parent will now pay BBDC $67m to reflect the fair value of the current CSA and will continue to provide full downside protection on two legacy companies. There was a similar restructure of the CSA in 2022.
There were 7 remaining issuers in the CSA portfolio with now 5 after the full downside protection on 2 names. The maximum downside to the NAV is less than 3% and, likely significantly less from this restructure. The additional cash is immediately accretive to NII as it can be put to work now.
The stock remains attractive on a valuation-adjusted basis.
Eaton Vance continued to cut CEF distributions with floating-rate exposure like $EFT, $EFR, $EVG, $EVF, $EVV though the cuts were marginal. A fund like EFR has been cutting for a couple of years now and its distribution is back to its level prior to the inflation spike in 2022.
The fact that EFR is still cutting is a bit unexpected for two reasons. One, the last cut happened about half-a-year ago and it takes a quarter for the Fed cut to make its way through accruals so the fund is cutting despite short-term rates no longer being a headwind to net income.
The second unexpected dynamic is that the fund is still cutting despite distributions being back to 2021 levels i.e. when short-term rates were zero vs. 3.6% today. The potential explanation for both is the same dynamic that’s been weighing on BDCs and CLO Equity CEFs which is loan refinancings to tighter spreads.
Check out our public repost of an earlier Q1 analysis of BDC $BXSL. The stock currently trades at a 13% dividend yield and a 10% discount.
https://t.co/MDb4p9bi0O
The main story had to do with the Medallia position and the rise in non-accruals. Management didn't really explain why the largest position in the portfolio was a recurring revenue loan. In any case, they are confident that by restructuring the debt (likely taking a further writedown) they can turn the business around. Let's see.
Private BDC BCRED published its April NAV which was down around 0.5%. That’s better than the average monthly drop of 0.8% in Q1. That will equate to a +0.2% total NAV return for the month which is still not the current performance investors want to see.
Public credit spreads fully reversed their Q1 widening. The Ares private fund ASIF did better with a 1.2% total NAV return, clearly benefitting from the tightening in public spreads.
It’s possible that Blackstone is still digesting Medallia and may have taken another small writedown as it restructured the loan. If that’s correct, then broader BDC April underlying performance was around a double-digit annualized level.
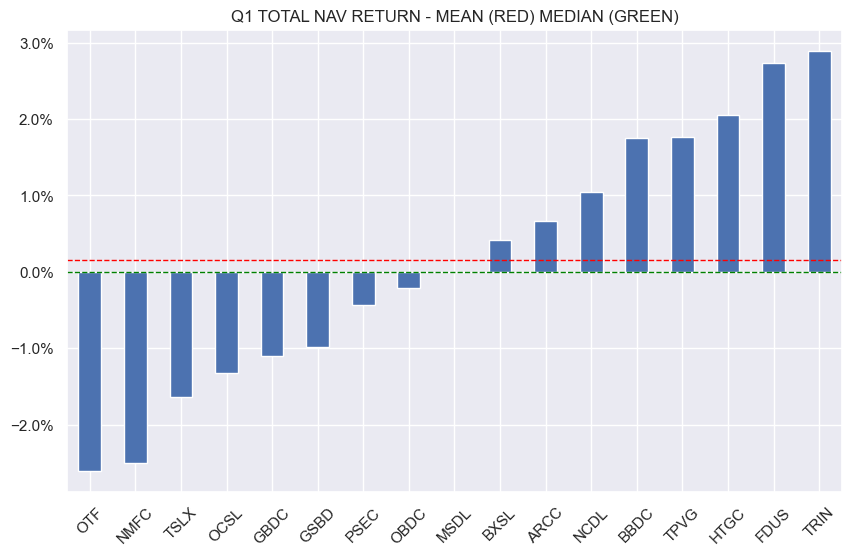
Check out our earlier take on the BDC $FDUS. The company delivered a very impressive 2.7% total NAV return in the quarter, outperforming the sector by 2.5% with an ROE of over 13%. Long FDUS.
https://t.co/q83pgS2BWx
There was a question about CEF and mREIT bonds and where they trade relative to their implied corporate bond ratings. If you look at the yields of these bonds, they will typically be in the range of 7.5%-9%. If we look at how credit ratings map to average bond yields, then the implied credit rating of these bonds is something like B- / C+.
To get a sense of what this means in practice, we can look at cohort cumulative default data which measures the default rate of a group of bonds that start off with a given rating (rather than updating the cohort as ratings change).
So, if we look at the B- / C+ cohort, we get something like a 6-10% annual default rate and something like a 20-30% 5-year cumulative default rate. These numbers are clearly too high relative to what the sectors have experienced.
The question is why do these bonds offer yields that appear high relative to their historic default rate (which has been negligible). One possibility is that these exchange-traded bonds aren’t well understood as they are largely retail-focused, have relatively small issuances and aren’t issued by traditional companies with normal corporate credit metrics. Confidence to allocate to them also relies on the knowledge of the workings and dynamics of a specific credit sector.
John Hancock released quarterly NII data for their CEFs. They have 3 preferred funds: $HPI, $HPF, $HPS, two bond funds: $HS, $JHI and two hybrid funds: $PDT, $HTD.
The prefereds CEF trio has coverage around 76-77% and this has risen about 2% over the past year as short-term rates have fallen. There should have been higher uplift from the drop in leverage costs given the relatively high leverage of 37%, a floating-rate credit facility and the fact that the Fed has cut the policy rate 3 times since August.
The main issue is that there are interest rate swaps that nearly fully hedge out the floating-rate of the credit facility, in effect swapping it out to a fixed-rate. This is fairly common in the preferreds sector though few other managers swap out nearly the full liability amount. Flaherty funds don’t do any rate-hedging which means that their CEF NII will rise at a faster clip than that of the JH funds. $FFC and others remain attractive here.
Q1 results for CLO Equity funds are coming in. These are less interesting than for their BDC counterparts as we get monthly NAVs from the sector. However, it is still useful for the commentary we get from management and the dynamics they see impacting performance.
$ECC largely blamed lower loan prices, particularly in the software sector, for the drop in the NAV which fell 27% during the quarter and bounced 9% in April as loan credit prices rose. ECC software exposure was 11% which is roughly half that of BDC exposure (and less on an NAV basis due to lower leverage).
Recall that management blamed a loan refinancing wave (driven by tighter public spreads from CLO demand) for the weakness in the NAV over the previous year. Over Q1, the culprit was wider spreads (i.e. lower loan prices) which pulled the NAV lower. This illustrates the concave profile of CLO Equity - big moves in spreads either way drive the NAV lower.
After doing not much for a while, bond yields have suddenly decided to start worrying about sustained inflation and started rising. 30Y Treasury bond yields blew through 5% and are up 0.26% over the past month while 5Y yields are up 0.43% from their respective troughs in the second half of April.
Part of the story is global - Japanese bond yields jumped on anticipated rate hikes and fiscal concerns while UK Gilt yields jumped on a likelihood of looser fiscal policy if the prime minister is defeated in a potential leadership contest.
In the US the rate market is pricing in a better than 50% chance of at least one rate hike by the end of this year.
In terms of portfolio implications, over the past month, CMT preferreds have gained 1% while fixed-rate preferreds have lost 0.2% on a total return basis. SOFR-based preferreds are up 0.8%. We have a half dozen of CMT preferreds in our Income Portfolios, including $AGNCL, $RITM-D and others.
With the BDC earnings seasons mostly at an end, what can we say? Well, the key metrics are kinda fine. NII is down quite a bit - by nearly 6% on a median basis. This is due to the combination of 1) Fed rate cut pass-through which is now fully done, 2) wider-spread loan repayments, 3) low deal environment, resulting in low fee levels. Notice that portfolio yield is down only 0.1%. Non-accruals are up 0.2%, pretty marginal and PIK is unchanged. All in all, credit metrics are fine. Nearly all of the tepid performance this quarter is due to net unrealized depreciation i.e. position markdowns as a result of public credit spread widening in Q1. This means we should see a solid result in Q2 if spreads stay where they are.
The trio of 2 Barings CEFs $MPV / $MCI along with the Barings BDC $BBDC highlight the bifurcation between the CEF and BDC markets. There is a lot of overlap between the CEFs and the BDC. However, the CEFs are trading at premiums while BBDC is at a 22% discount. Once valuations are taken into account, BBDC investors are clipping more than 5% of additional yield on their dollar of invested capital....because BDCs are bad and CEFs (that allocate to private loans) are fine?
Check out our post on $BANX - discussing this bank reg-cap CEF, posted originally on our service a few weeks ago. TLDR - income investors should start to consider bank regulatory capital (aka confusingly CRT i.e. Capital Relief Transactions, not Credit Risk Transfer mortgage assets) as part of a broader income portfolio.
https://t.co/oV8Ba4xcY4
BDC $FDUS had a great quarter with a 2.7% total NAV return - 3rd best so far (out of 20+ names processed in our BDC Tool). NII jumped 20% to the highest level since 2023, driven by a one-off fee from a refinancing of a position. Non-accruals at cost fell to 0.8% - very low by sector standards and leverage remained low as well. On a valuation-adjusted basis the stock remains attractive as shown below. Makes sense as a diversifier in a portfolio otherwise allocated to upper middle-market larger BDCs.
BDC Q1 total NAV returns are running at around zero with little sign of the apocalypse. The market has woken up to this and the average BDC is up 13% off its 1Y lows. Public credit spreads have tightened back so Q2 NAVs should get a bounce while NII could even move higher as deal activity increases, leading to higher fees, while capital flight leads to better deal terms at higher yields.