What if famous artists lived in our times and engaged in #dataviz?
My new project, 'Palettes of Famous Paintings,' in #Tableau@tableaupublic, features 150 different color palettes based on the colors used in paintings by renowned artists.
https://t.co/NYWEkD0vX3
#datafam
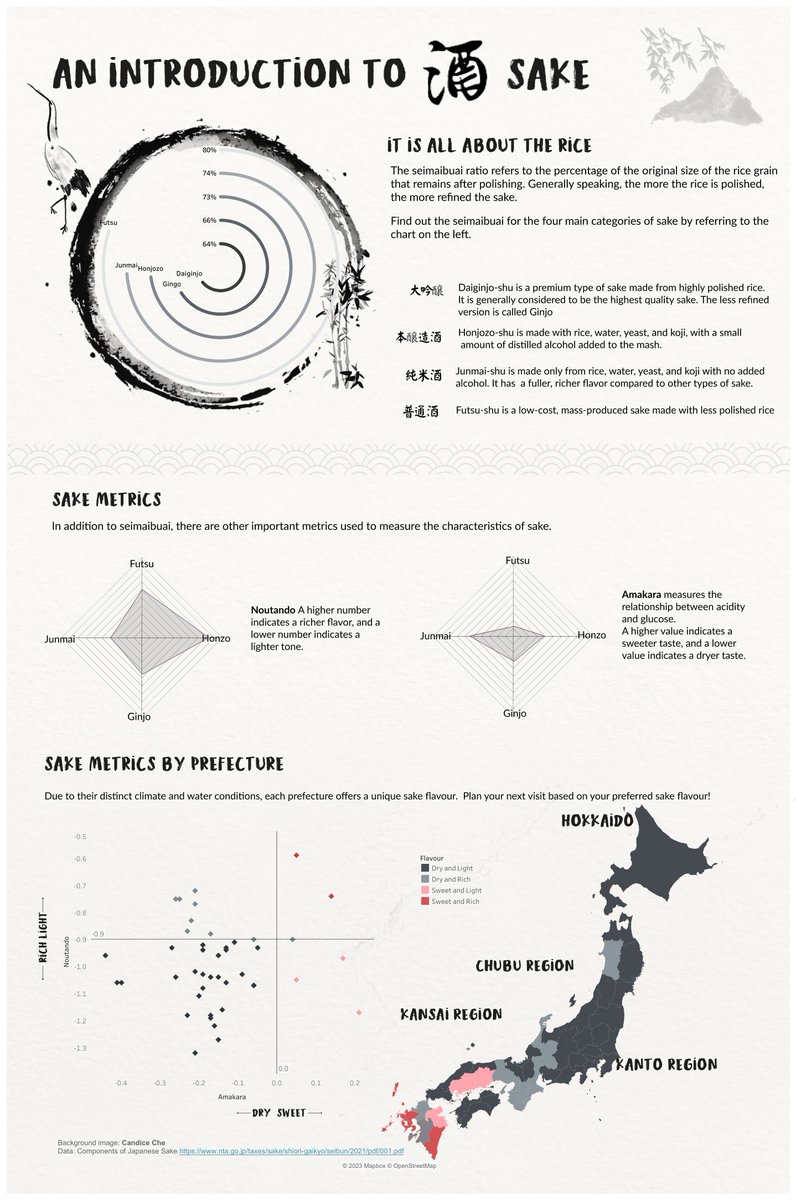
New Viz: An introduction to #Sake
I mentioned wanting to do a collab dashboard of the East Asia culture in the community highlight; Well, It is here. Thanks to the data and guidance from @ritz_Tableau. @Rika_Olga_F#datafam https://t.co/5l831kiG2n via @tableaupublic
#GamesNightViz has a surprise for the #datafam! We sat down with @tableau#IronViz champ @paulbrianross to chat about his journey and his advice to new folks starting out in the community. Hope you find it inspiring and entertaining to watch. 🎮📊📈
https://t.co/FeKmb7FkWk
Guess what just came through today!
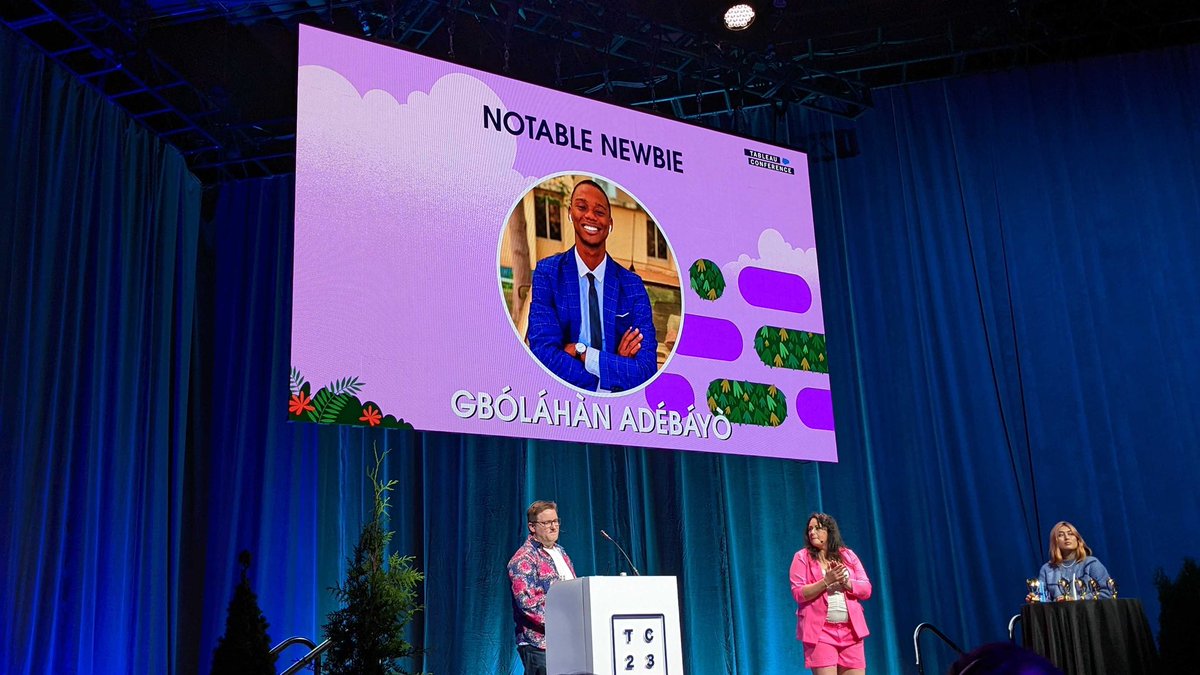
It’s my vizzes award 😍🏆 and it most certainly looks beautiful 🤩
Thank you so much @Matt_Francis and @tableau for this amazing award 😁
Thank you #datafam… this means a lot!
Just got to find out that I won a Vizzes award at the Tableau Conference for the Notable Newbie!!!
This is so amazing!!! 😍😍😍
Thank you so much everyone for the constant feedback and love. Cheers to doing more and being a part of the amazing #datafam
Thank you #data23 ❤️
#TinyTableauTip or not, it was a refresher tip for me: To create a parameter based on a Dimension in @tableau, simply select the Dimension and use the keyboard shortcut *Ctrl+Shift+P*; #Tableau will automatically generate a #parameter with the values listed. #datafam
New Viz: Evaluating the access of slum residents to health care centres in Jakarta, Indonesia.
Any feedback is welcome as always.
#tableau#datafam#spatialanalysis
Transforming #DataScience with #Tableau 📊! Unearth insights🌐from your data, weave captivating stories & drive understanding. No more getting lost in the data jungle - let Tableau be your guide! Join the #datafam adventure🚀: https://t.co/Rqc74T4Okp
Mental Disorders in Brazil
Brazil is considered the most anxious country in the world and the fifth most depressed.
Link to Dashboard : https://t.co/cQZSnQjddS
#DataFam#tableau#saudemental#mentalhealth
#datafam, got an interesting use case. Client wants to show static image of a @Tableau dashboard on officescreens. 4 similar kpi's for 4 departments. Anyone got some inspiration of look&feel, right now its really repetetive with numbers and sparklines...