#TECHCHARTSMEMBERS Latest Global Equity Markets report is sent out with
7 new #breakout#alerts
8 additions to #watchlist
Breakouts page will be updated later this weekend.
https://t.co/tbg6nYBgvM
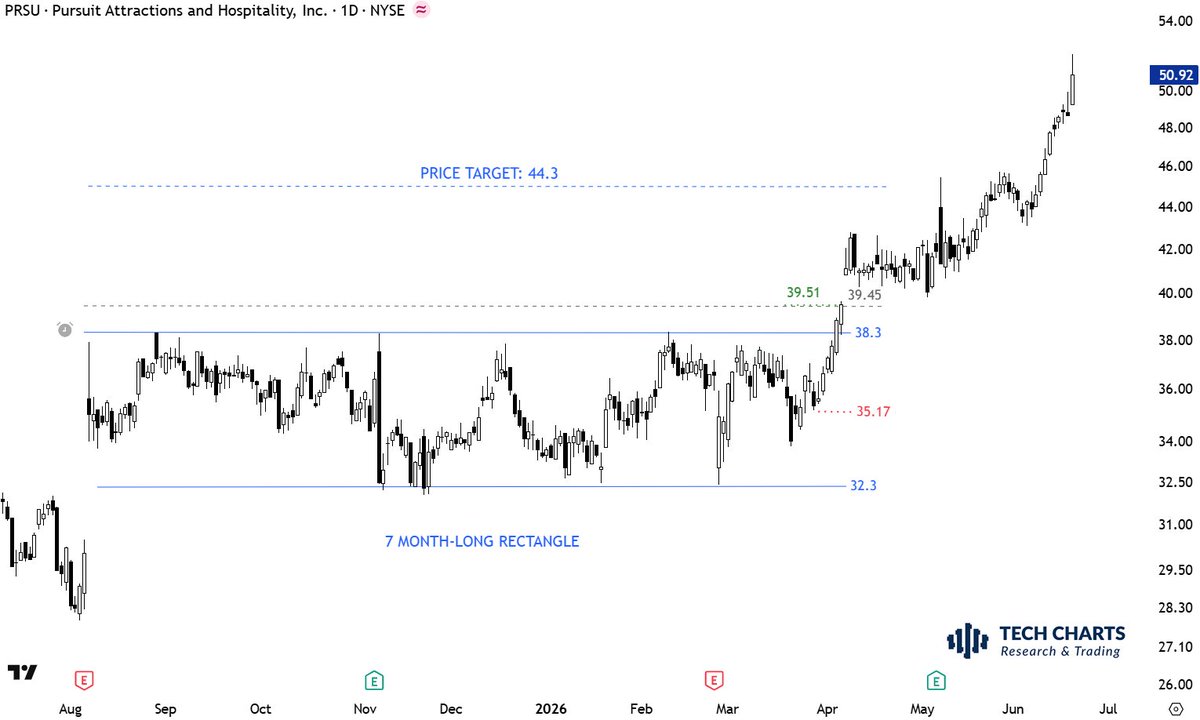
Several high probability horizontal setups are coming your way with the upcoming Global Equity Markets report.
Stay tuned >> https://t.co/3PXD6BGq77
If there is no significant rebound from that lower boundary, next test of 111 levels can break it down resulting in lower Bond prices and higher yields.
$BTCUSD So far the rebound on weekly scale looks weak. In one week price fell from 74K to 60K. It's been 2 weeks we are at 62K. Counter moves are weak. Still a downtrend with an important support at 60K.
Macro experts, can a strong Dollar, strong equities especially EM, co exist?
Correlation experts, has these been time periods where we had both and under what condition?
$DXY what will this consolidation prove to be?
A reversal like 2014 and 2021?
OR
a bearish continuation that breaks down the long-term channel?
Levels to monitor are labelled on the chart. It requires monthly closing.
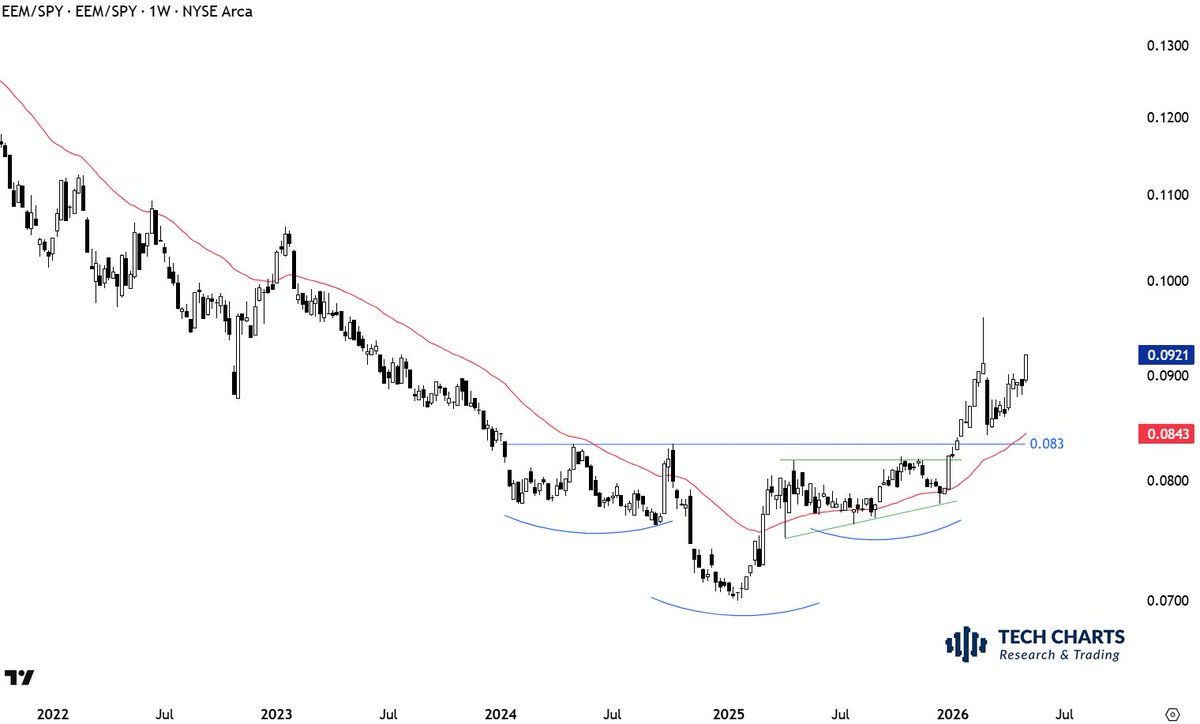
#TECHCHARTSMEMBERS This chart has been on our #watchlist for some time. It started as a H&S continuation and might be ready for a breakout confirmation. The right shoulder is now a mature ascending triangle as well. So 2 bullish setups are completing at the same time.
Access >> https://t.co/RZpcoj4SWU