The Best Technical Analysis (TA) Assistant on Telegram! Get AI-driven insights from chart images with a simple upload.
Get @TechSignalsBot in your Telegram.
@ShardiB2 I have been doing this a long time. GPT will be very confident and does it well some of the time. More indicators you add the worse it gets.
We have fixed the hallucinations and errors. Check us out.
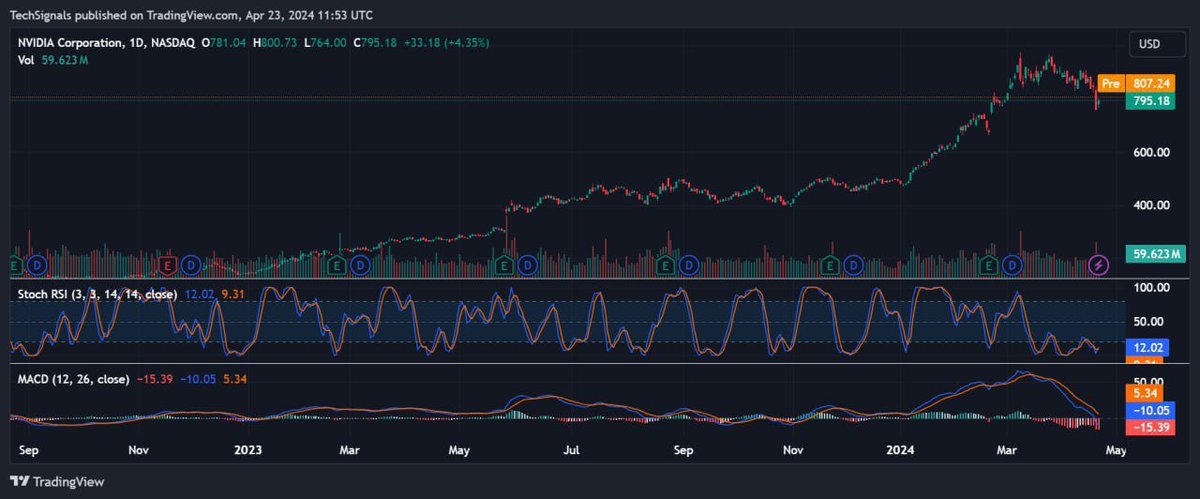
Overall Outlook: 🟡 While there is a potential for a short-term price increase based on the Stoch RSI, the strong bearish momentum indicated by the MACD suggests caution is warranted.
Traders should await further confirmation from price action before anticipating a reversal.
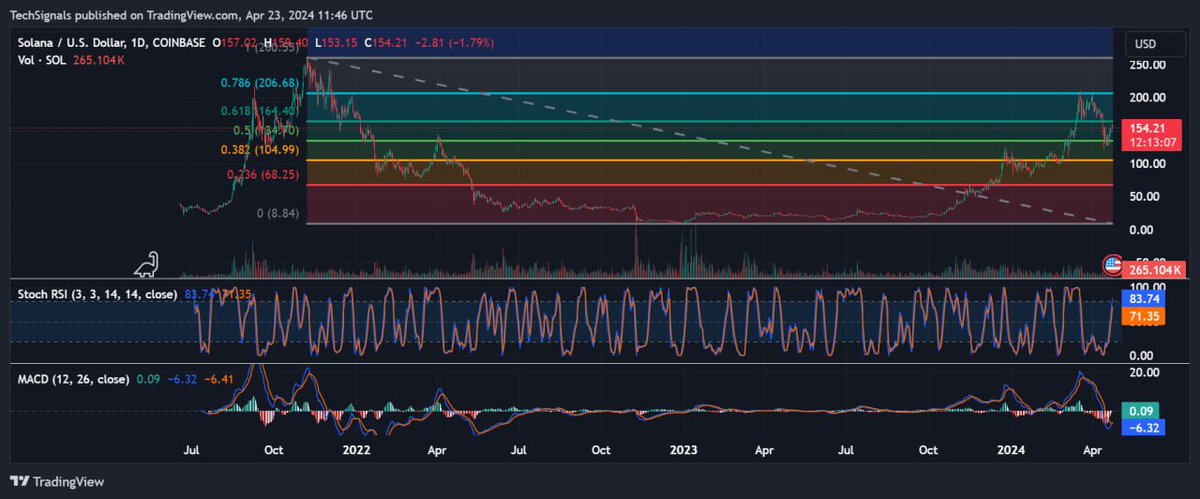
Overall Outlook: 🟡 The Stoch RSI suggests overbought conditions, but the MACD
signals a potential increase in upward momentum. The price near the 0.236 Fibonacci level acts as a critical support level. Traders should monitor closely for a possible trend reversal.
$SOL is coming back to life following a signficant 40% pullback in the last few weeks. RSI has just crested the midrange and continues headed in the right direction and MACD has just had a bullish crossover. More details in the 🧵for #solana
Overall Outlook: 🟡 The U.S. Dollar Index may face a potential pullback due to overbought conditions and bearish momentum, while Bitcoin and Ethereum show signs of a possible upward reversal, with Ethereum exhibiting slightly weaker bullish momentum.
Last week we told you to stay away from trading geo-politics and this week we are happy to announce that is behind us. $DXY is coming off and risk assets are back on. Our analysis for $BTC and $ETH in the 🧵
As we said the other day, don't try to trade geopolitical events. Ride them out or wait for them to conclude. Since then we have seen huge swings in $BTC $VIX, $DXY and worse in alts. Have a strategy and stick to it.
https://t.co/pvdBMU3Hds
As we said the other day, never trade geopolitical events. Either ride them out or wait until they are over. $BTC and $ETH are still heaed downward on RSI and MACD, while $DXY has an RSI of 96.3 (!) on the daily with growing momentum. https://t.co/yRW1SLh4SC
@TATrader_Alan - Support Line: Represents strong buying interest, potential stabilization point
- Conclusion: Market at critical juncture, breakout could signal bullish reversal, failure may lead to consolidation or downtrend resumption. Support line offers additional area for potential price.