#Hyderabad’s water systems were designed to store water. #Lakes overflowed into other lakes. Water slowed down, spread out,recharged the ground & eventually reached the river
We built lake atlas to explore this
https://t.co/AjLzld27gQ
@amaringanti@Amruthkiran94@hulfoundation
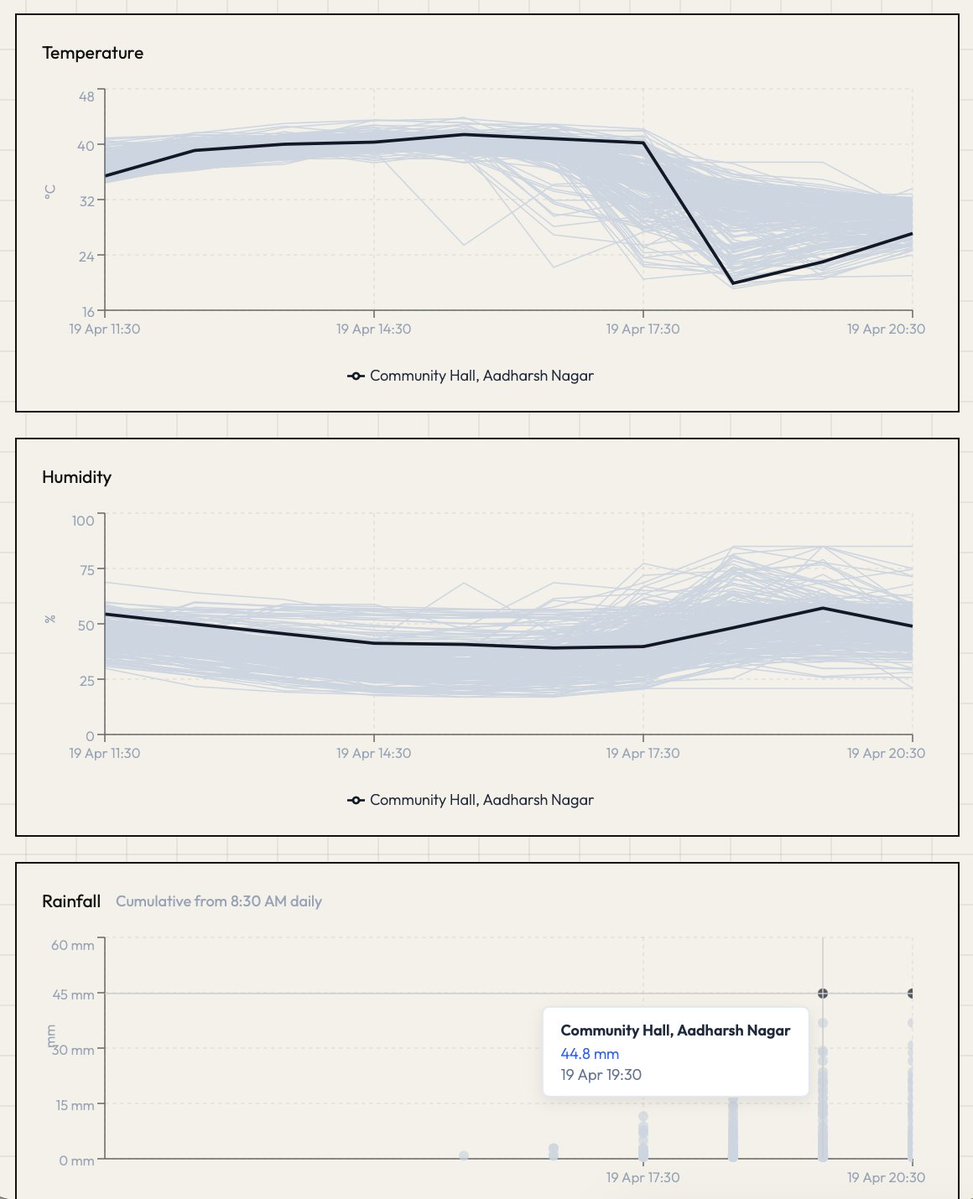
You can now explore temperature, humidity, and rainfall data, along with trends over time, through the Hyderabad Urban Observatory platform.
Access the weather dashboard here -
https://t.co/DUWO72nJz3
1/n
You can now explore temperature, humidity, and rainfall data, along with trends over time, through the Hyderabad Urban Observatory platform.
Access the weather dashboard here -
https://t.co/DUWO72nJz3
1/n
This is a work in progress, but sharing it early as some areas in Hyderabad are already experiencing temperatures as high as 44°C this season. We hope this can help support public awareness and contribute toward identifying high risk areas for heat stress.
3/n
Explore declassified satellite imagery of the Hyderabad region from 1967, 1974, and 1979 - https://t.co/VftJwvMxoG
These high resolution images provide an incredibly detailed snapshot of what Hyderabad looked like in the late 1960s and 1970s.
#Hyderabad
@RamSeraph Hi. These are from the USGS EE under declassified imagery. only some of these are scanned and released. For the rest of those, they charge $30 per scene. I have just added what is available for now.
#Hyderabad is organised into 3 corporations, comprising 12 zones, 60 circles, and 300 wards.
You can now explore each ward, its corresponding circle, zone, and corporation boundaries as interactive dataset on the Hyderabad Urban Observatory.
https://t.co/eeOZqEuVAl
There has been no official release of the data. This is independent effort to digitise and bring these boundaries online for public access. Will be updated as and when official data becomes available. If you notice any errors or have verified info to share, please do reach out.
#Hyderabad is organised into 3 corporations, comprising 12 zones, 60 circles, and 300 wards.
You can now explore each ward, its corresponding circle, zone, and corporation boundaries as interactive dataset on the Hyderabad Urban Observatory.
https://t.co/eeOZqEuVAl
@VijayMallangi Hello @VijayMallangi I have only seen the gazette notification on the GHMC site regarding this, & it is still text-based information. The maps still show 150 wards. Currently adding info about zones & circles from publicly available maps and images, & will update this soon.
New data layers are now available on the observatory, including the recently proposed 300 wards of #GHMC. and can compare with the current ward boundaries directly on the platform.
🔗 https://t.co/eeOZqEunKN
#Hyderabad#UrbanObservatory#GHMC@hulfoundation@SQMasood@serish
see which lakes have disappeared between the 1914 and 1975 archival maps.
https://t.co/OoqgwKHkAa
one of the key objectives of the #Hyderabad#UrbanObservatory is to make these important datasets accessible..