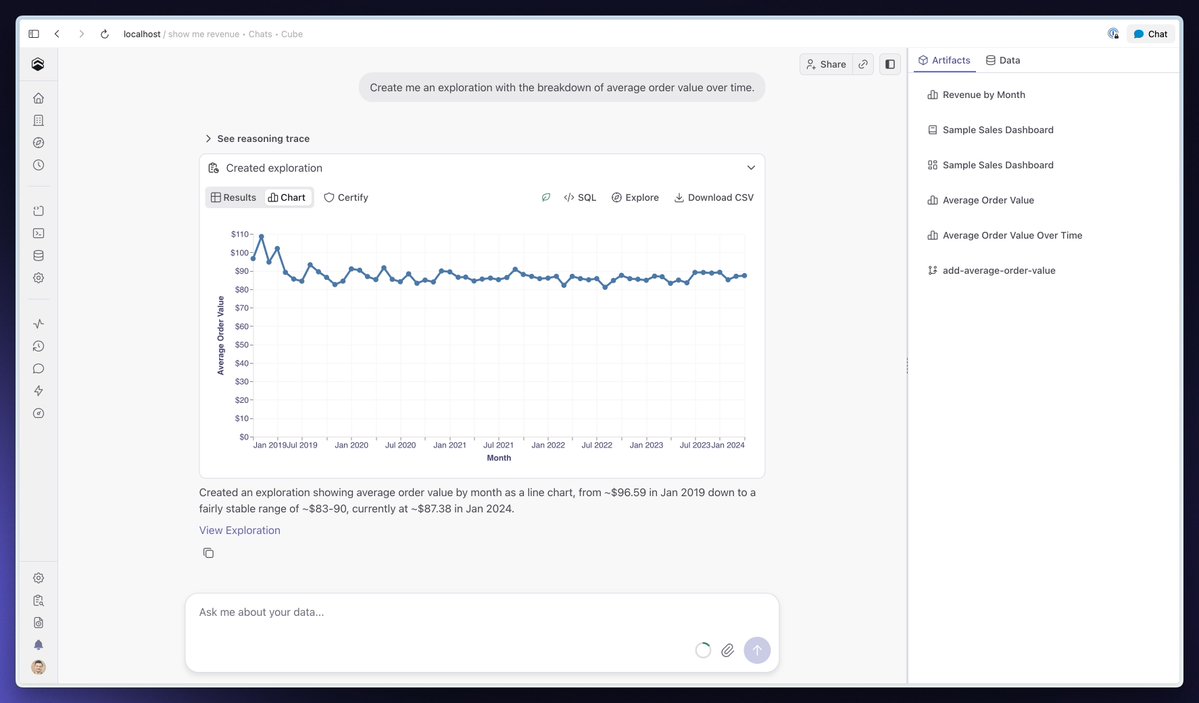
New in Cube: agentic analytics, one connector away from Claude.
Agents don't need a better prompt. They need a harness — tools, context, checks, and a semantic layer that keeps every answer governed.
https://t.co/Qi7Cj2YL35
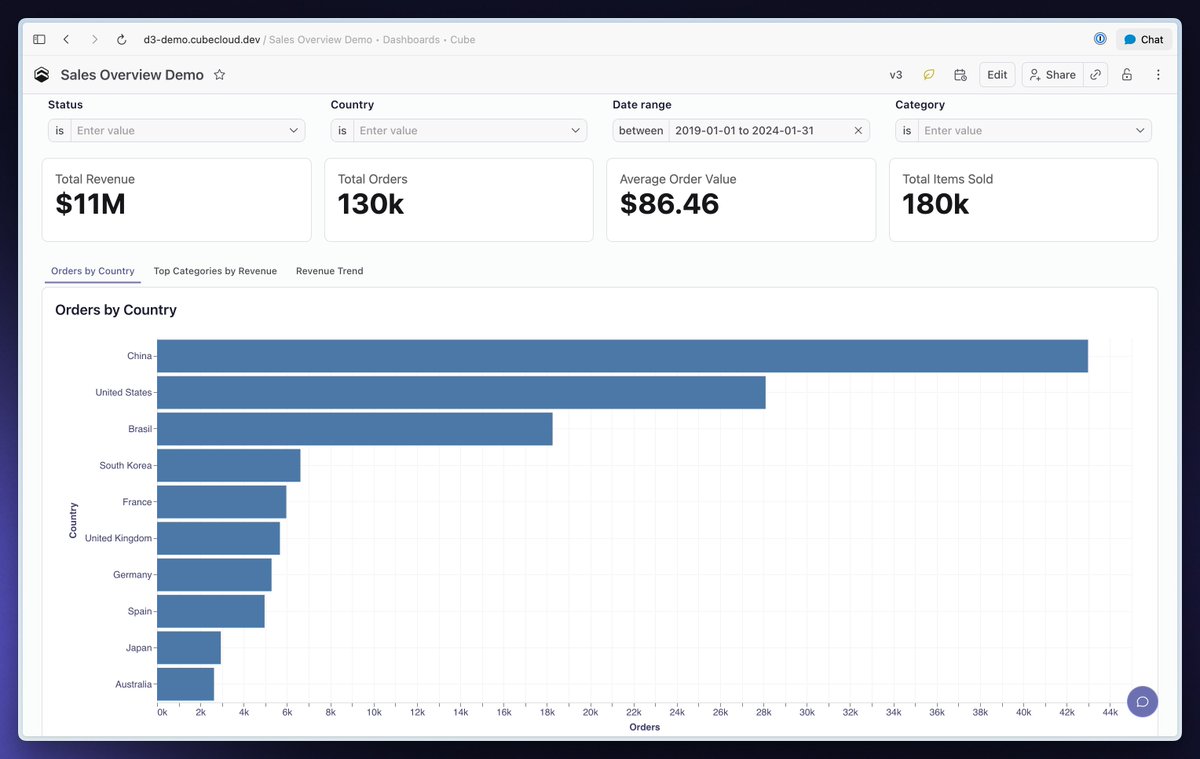
Cube Dashboard tabs keep related charts together without making pages longer. Shared links reopen the selected tab; downloads preserve it, and scheduled exports include each tab as a titled section. https://t.co/1oz7KCc4jt
Cube table row grouping folds complex result sets into a collapsible hierarchy. The demo enables grouping, collapses levels, and shows subtotals that stay correct across additive and non-additive measures.
Full demo: https://t.co/RM9dXjxjhA
Cube for Sheets and Excel now puts every exploration in a document-aware sidebar. Refresh all queries at once, build pivots by drag-and-drop, and catch cell conflicts before overwriting data.
Full demo: https://t.co/dSSCuTVzWL
Cube dashboard stack containers organize related widgets without manual alignment. Use Horizontal or Vertical Stack to group elements and distribute them evenly by width or height.
Full demo: https://t.co/AALZ80fAdV
Cube’s dashboard Field Switcher lets viewers change chart dimensions and measures on demand. Pair it with a Parent control to switch multiple fields across connected views.
Full demo: https://t.co/yt1wxZlrZu
Cube record tables make row-level analysis easier: display one record as readable fields, compare multiple records side by side, and switch from dense rows to a detail-first view. Where would you use this?
New in Cube: composite charts.
Combine multiple measures in one chart, then set the chart type, axis, breakdown, color, line style, and point shape for each one.
See the full changelog: https://t.co/lsmlbsxAxz
A large context window can still be overloaded. Treat agent context as a budget: page big results, label truncation, and search governed metrics on demand. Five production lessons: https://t.co/cNi0HgNhnc
Cube funnel charts make conversion drop-off easier to inspect: select a funnel view, compare each step, and spot where the largest drop-offs happen.
Full demo: https://t.co/C0Kw7AJWXy
Agents can write SQL, but schemas do not explain how a business defines revenue, joins, or access policy. Cube argues the semantic layer is the safer interface for governed agentic analytics. https://t.co/n8KZsU4xEn
Cube smart data visualization selector helps pick a chart that fits the query result: inspect the data shape, switch views quickly, and get to a clearer dashboard faster.
Full demo: https://t.co/YAKfUsqTRZ
Cube iframe events help host apps react to embedded analytics activity.
Listen for message events, detect views, navigation, downloads, drilldowns, AI queries, and errors, then connect those actions back to your product workflows.
What would you automate from an embed event?
Cube bins and value groups turn noisy raw values into cleaner analysis buckets: create numeric ranges, group categories, and make charts easier to scan.
Full demo: https://t.co/GGag0pcLAH
New in Cube: Chat Artifacts keeps model branches, Workbooks, Dashboards, and saved explorations tied to each Analytics Chat—so teams can switch conversations, work in parallel, and keep context intact.
https://t.co/tcd6igDAx6
Cube time zone controls now cover users, dashboards, embeds, and agents, so global teams can keep results aligned to the right local reporting window.
Full demo: https://t.co/IY3bZGE0Bc
Cube Fill in Missing Rows keeps time-series charts from dropping empty dates.
The demo shows one-click missing day/week/month rows, untouched source results, and zero points so chart gaps are visible.
Full demo: https://t.co/1zQLN2ceoP
Cube dashboard chart downloads let viewers export individual charts as PNG or PDF for docs, decks, and stakeholder updates without rebuilding the visual elsewhere.
Cube results freshness indicators show how recently chart data was updated.
The demo covers the signal in workbooks, dashboard builder, and published dashboards so viewers can judge recency at a glance.
Full demo: https://t.co/OJtk4MtBbV