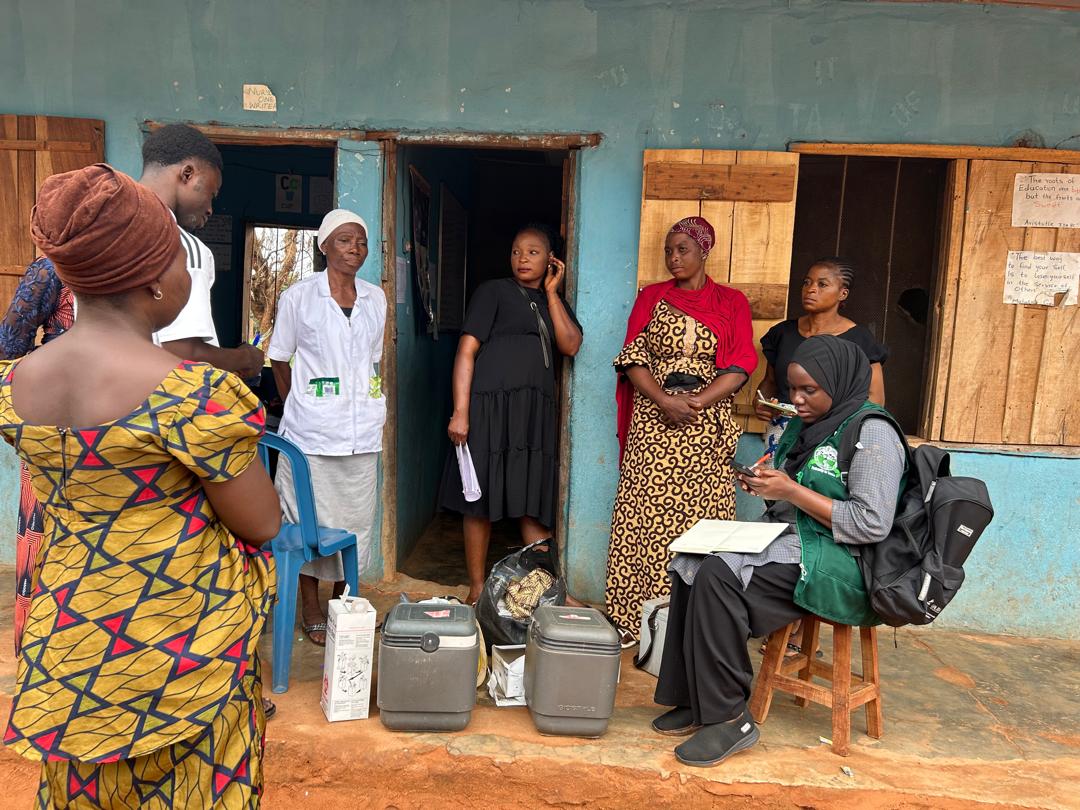
While misinformation and disinformation spreads faster on #SocialMedia, the technology has been helpful in monitoring trends in the ongoing #COVID19 pandemic, thereby guiding decisions towards economic recovery when triangulated with other datasets.
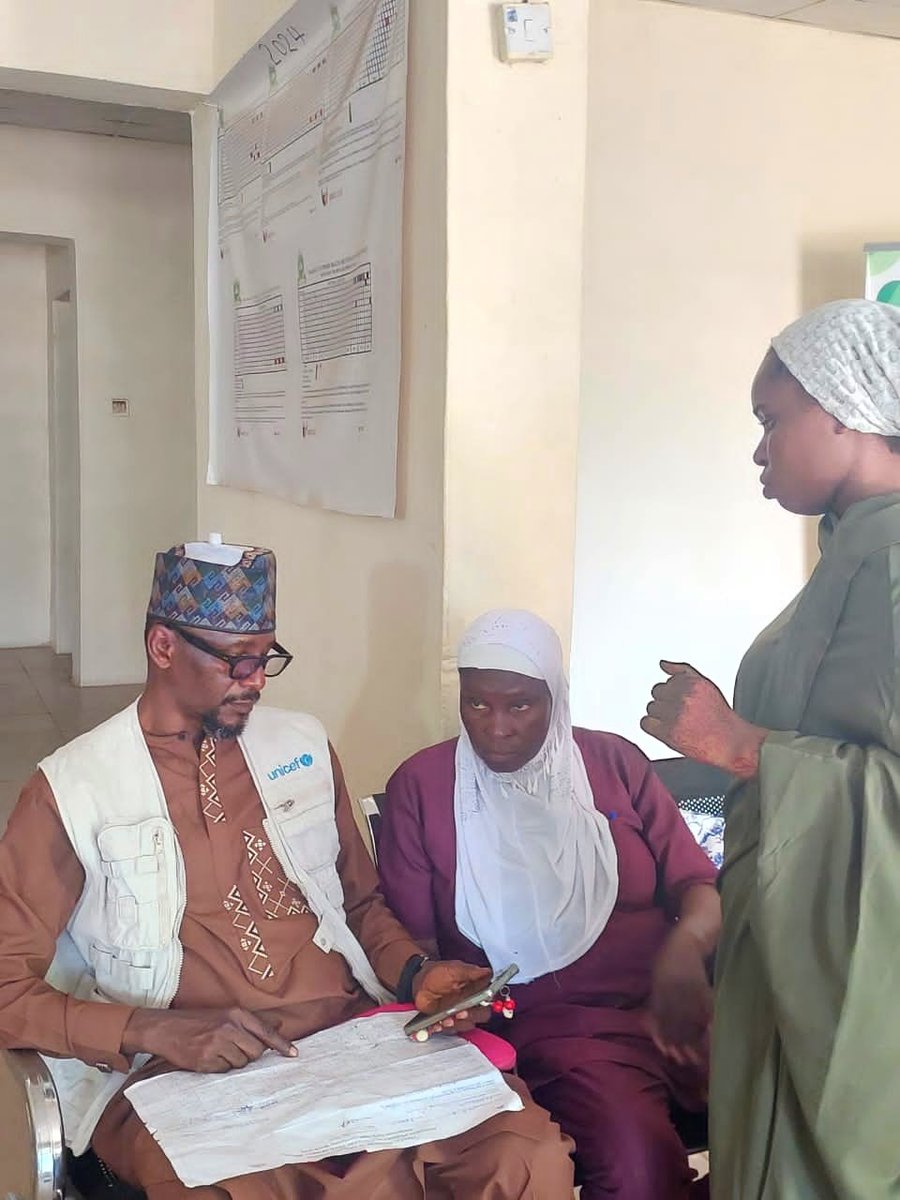
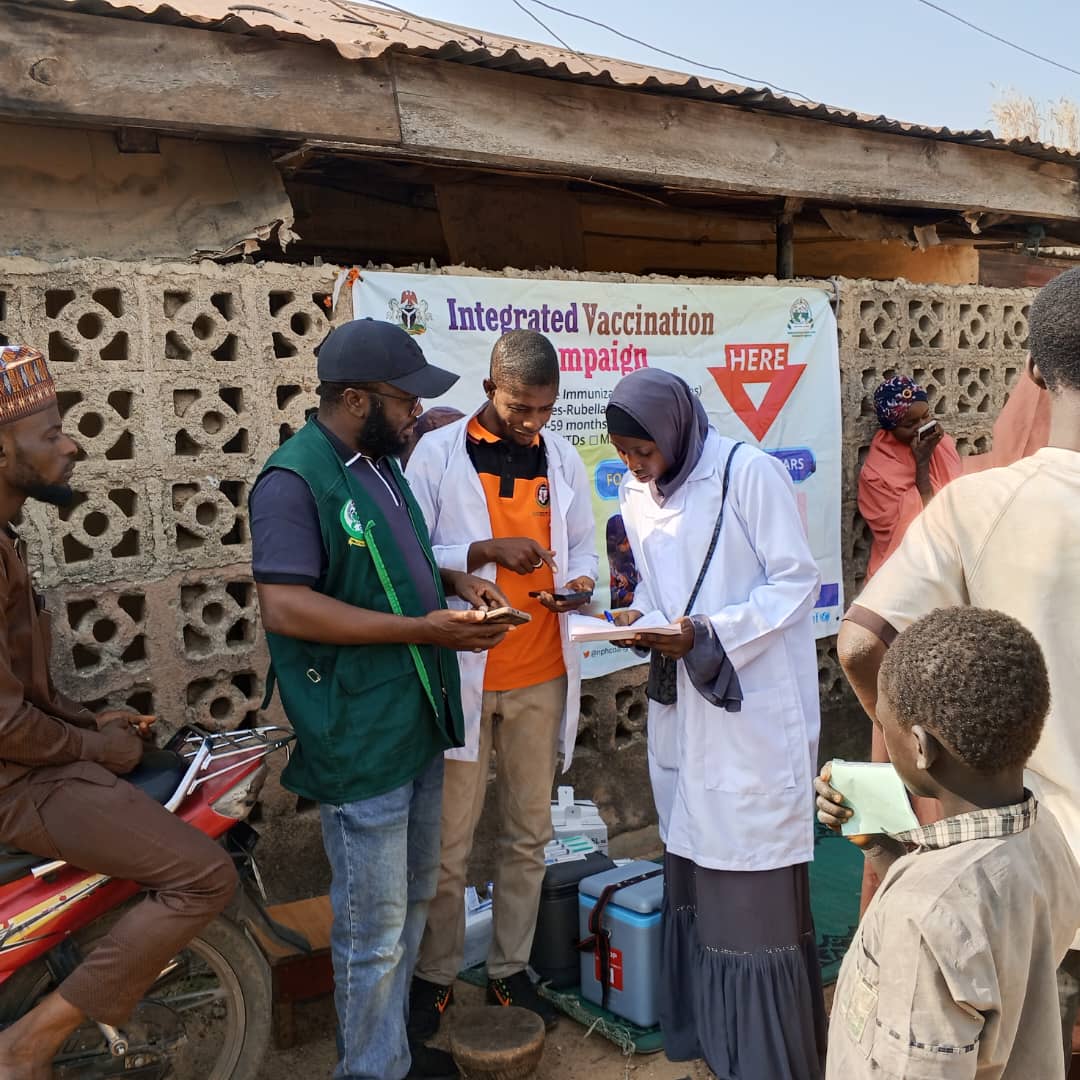
Thanks to strong leadership at @NphcdaNG driving digital innovation, the Integrated Vaccination Campaign is using real-time data to guide swift decisions, enhance accountability, & ensure every community is reached.
#measlesrubellafreenaija#integratedcampaign
Vaccines save lives.
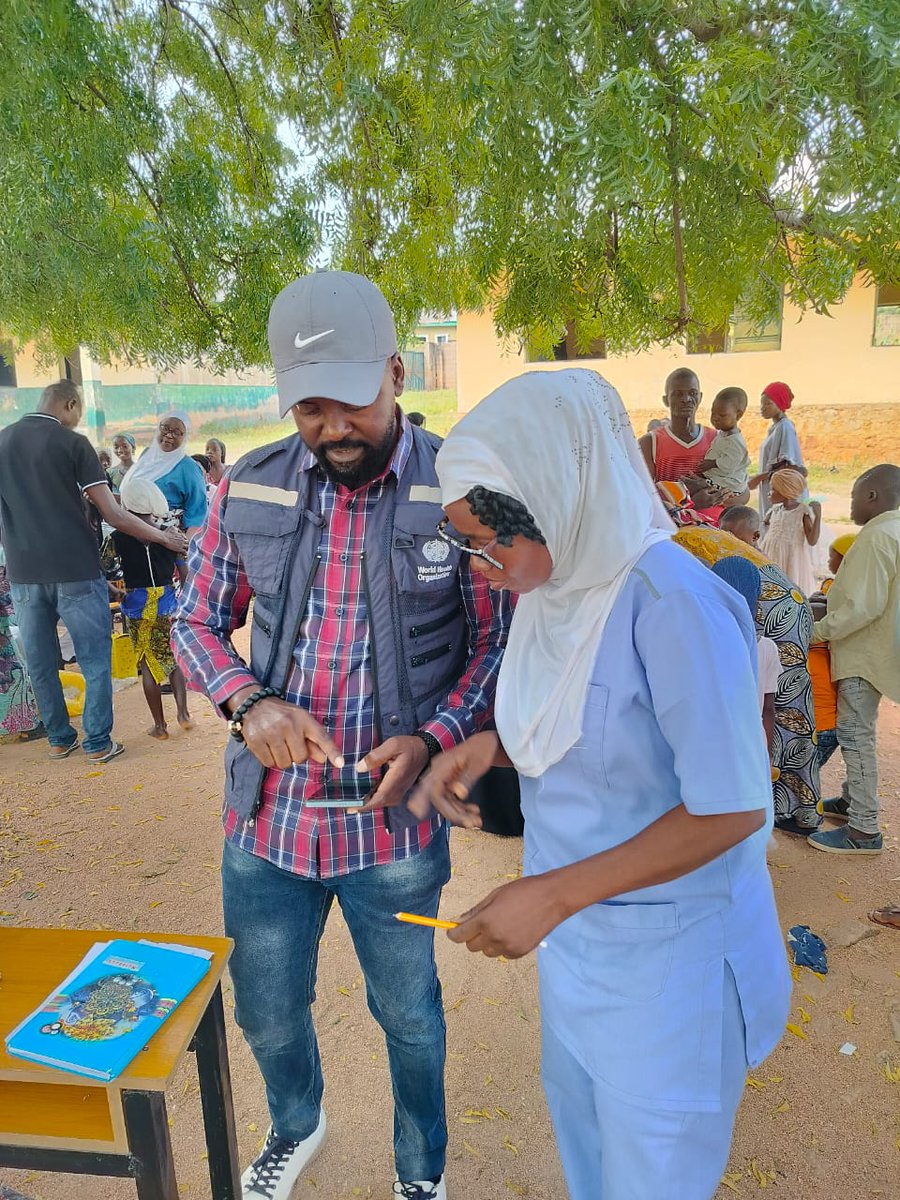
@WHONigeria team in action, supporting @Fmohnigeria to vaccinate 106 million children against measles, rubella, and polio.
Working with countries, we are delivering #HopefulFutures for all our children.
https://t.co/3ioBGC2gaY
Understanding the difference between correlation and regression is crucial in data analysis. While both concepts explore relationships between variables, they serve different purposes and are often misunderstood.
✔️ Correlation measures the strength and direction of a linear relationship between two variables, providing insight into how changes in one variable might be associated with changes in another. It's a quick way to assess relationships before diving deeper.
✔️ Regression goes a step further by modeling the relationship, allowing you to predict one variable based on another. However, it's important to note that in a simple (one predictor) regression, the fully standardized beta is equal to the correlation coefficient. Both correlation and regression measure associations, not causation.
❌ Confusing correlation with regression can lead to inaccurate conclusions, like mistaking association for causation. This error can mislead your data-driven decisions and compromise the validity of your analysis. Remember, predicting one variable based on another indicates a relationship but does not imply causation unless the study design explicitly supports it.
❌ Relying solely on correlation without understanding its limitations can result in overlooking more complex relationships that only regression analysis can uncover.
In the visualization provided, we see a scatter plot showing the relationship between horsepower (HP) and miles per gallon (MPG) in the mtcars data set. The blue dots represent the correlation between HP and MPG, showing how the two variables move together. The orange dashed line is the regression line, predicting MPG based on HP.
🔹 In R: Use ggplot2 for creating rich visualizations like the one shown. The geom_point function plots the data points, while geom_smooth(method = "lm") adds the regression line.
🔹 In Python: The seaborn library provides similar functionality. Use sns.scatterplot() for the scatter plot and sns.regplot() for the regression line.
If you want to learn more about how to use these methods in practice, check out my online course on Statistical Methods in R. It covers this topic in detail, along with many others!
See this link for additional information: https://t.co/7YQCRDKSPO
#DataScientist #RStats #datavis #Rpackage
@niki_popper@Leopoldina@rki_de@WHO@fitzner_julia knows her onions - building a collaborative and federated open community for global health alliances is the way forward for analytics, modelling, insights and the multi-directional actions required for global health. @WHO in #MONID2024
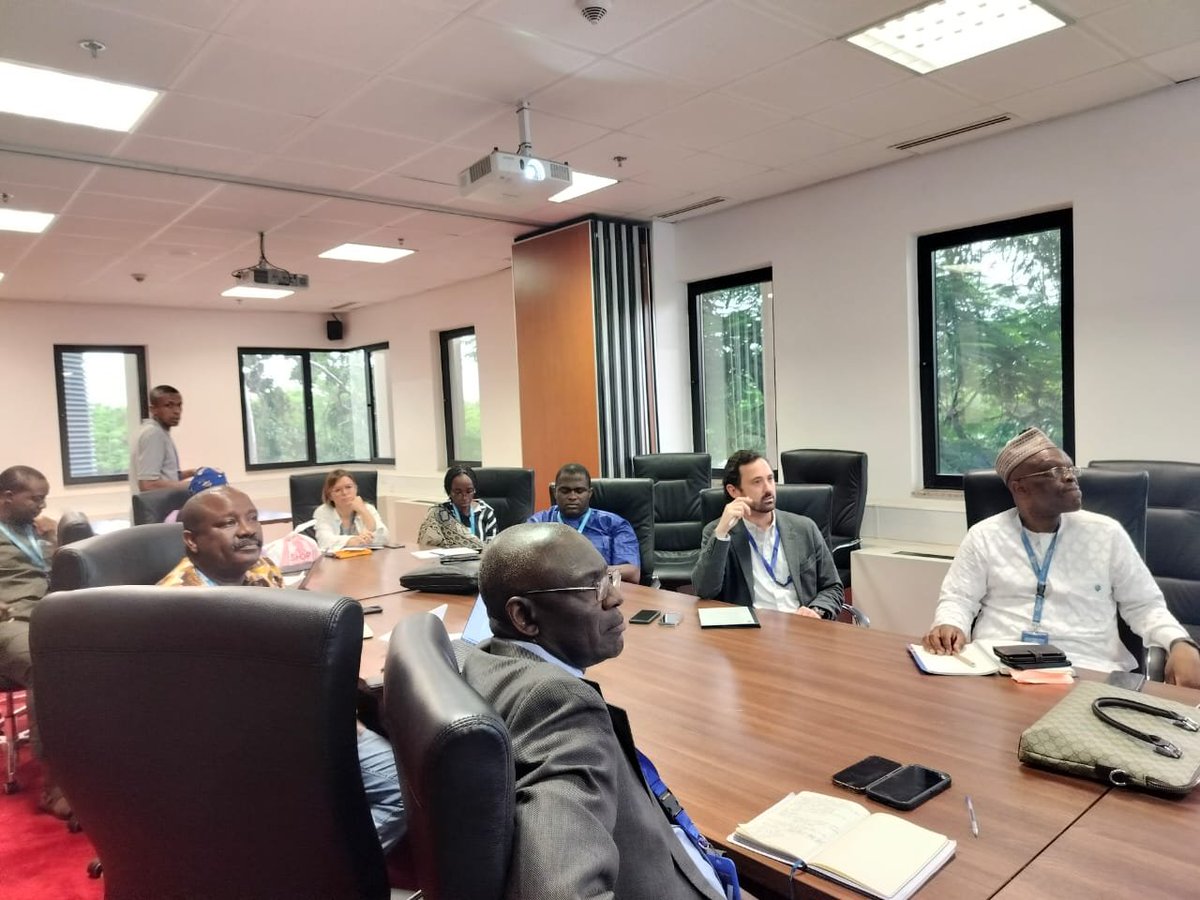
Our weekly polio team meeting of @WHONigeria to review the technical guidance we provide to the polio programme in Nigeria & our team performance as a journey towards zero circulating Vaccine Polio Virus in 2024. Expectations are high & the team is energized to produce results.
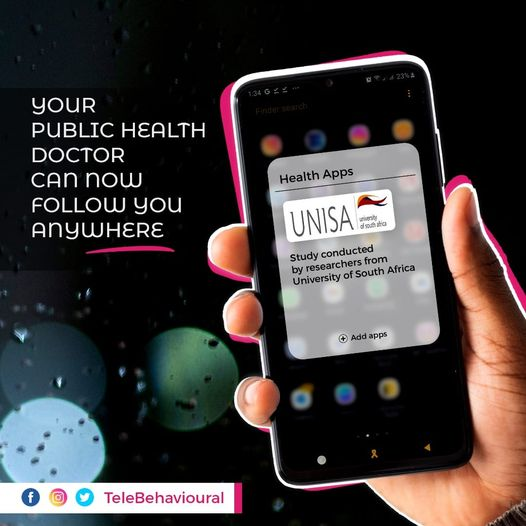
Telebehavioural - our AI-powered technology that tells your behavior and predicts the personalized medical treatment and medications you need.
Take our survey: https://t.co/Rg9L06M88Z
As part of my 2023 achievement for Staff Development and Learning in "Promoting Health" in the African region - I took part in some store telling certificate courses in journalism to aid the communication of the work we do in #Health. I'm #ProudToBeWHO!
I joined the team of Epidemiologists & Environmentalists from government & partner agencies to facilitate the Review Meeting for Environmental #Disease Surveillance & its optimization as a journey towards zero #polio-variant virus in Nigeria. #VaccinesWork#HealthForAll
https://t.co/w644KMKCrL
Your #Digital#Health footprints become available to your physician every time you use this social media platform. Public health physicians utilize these footprints in the form of #Data to understand your behaviors and plan health service delivery for you
4⃣ Improving the quality of supplemental immunization activities in accessible areas
5⃣ Increasing demand for immunization services.
6⃣ Human Resources
Abuja, Aug 11, 2023.
Joint monthly meeting of WHO-BMGF to review the journey to zero cVDPV2 in Nigeria. Technical discussions on identified strategies to zero cVDPV2:
1⃣ Expanding access to insecure areas
2⃣ Improving routine immunization
3⃣ Starting in-between round activities
Each time I see any of the series of #FastAndFurious, I take my mind off the film trick and focus on the message of "la familia" - hold us in your heart, and you'll never lose your way. The problem of having a big family is that you can't protect 'em all! RIP Paul W. #FastX
In those 10 days I learnt to be assertive - they're experts in their various specialisations in Public Health. They told me that my engagement in the meetings helped them to learn a new word "Co-Creation" - Human-Centered innovative approach to generate demand for health services
In the last 10 I have been in a series of meetings with these distinguished professors selected from reputable universities in Nigeria as the governing body for the polio eradication programme in Nigeria - their work feeds into the @WHOAFRO ARCC on polio.
@GoogleHealth Our study objective for "An Appraisal of the Roles of Digital Health Technology in Africa" is to assess the ease of doing health-tech business in Africa for startups and developers - @TeleBehavioural is the study handle and data collection link here - https://t.co/0kk5bCK3qC
The people that I work for/with have been improving public #health for 75 years and still counting. This #WHO75#HealthForAll is about:
💙 75 years of health & well-being.
💙 75 years of medical research.
💙 75 years of disease prevention & treatment.