Market structure over market noise.
I help Indian traders stop overtrading by understanding price behavior.
No tips. No hype. Just logic.
#StockMarket#trading
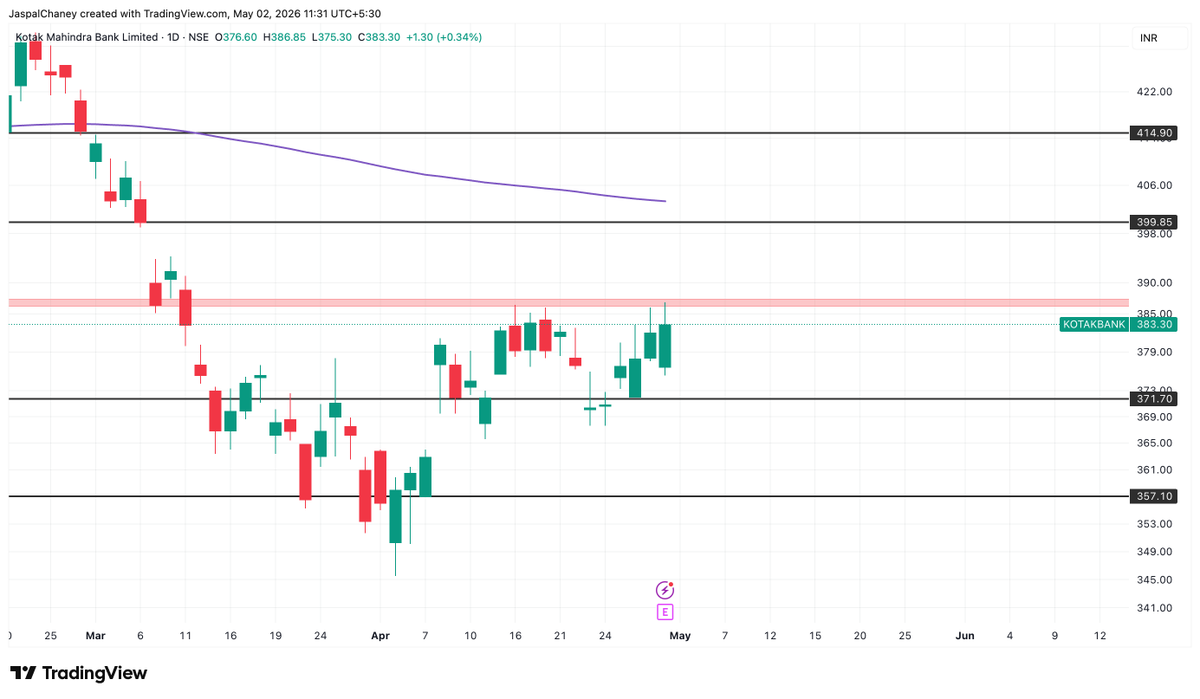
#KOTAKBANK showing strong recovery from ₹357 support with buyers steadily pushing price toward the key resistance zone near ₹385.
A decisive breakout above ₹385 could open upside toward ₹399-415 levels, while ₹371 remains crucial short-term support.
Momentum improving ..📈
Strong performance from Infosys in FY26 with steady growth and profitability.
Revenue came in at ₹1,78,650 Cr (+~9.6% YoY), while net profit stood at ₹29,474 Cr (+~10% YoY), reflecting consistent execution despite global macro challenges.
Operating strength remains visible with robust cash flows (~₹33,986 Cr from operations) and disciplined cost structure.
However, equity declined slightly due to buybacks and dividends, signaling continued shareholder returns focus.
📊 Key takeaway:
Stable growth + strong cash generation + capital return strategy = structurally solid business.
#stockmarket #stockmarketindia #infy #priceaction #fundamentalanalysis #technicalanalysis #research #trading
SBI Life FY26 Results Update 📊SBI Life delivered a steady performance for FY26 with strong premium growth and resilient fundamentals.🔹 Gross Premium crossed ₹99,955 Cr for FY26
🔹 PAT stood at ~₹2,470 Cr for the year
🔹 Solvency Ratio remains healthy at ~1.90
🔹 Embedded Value at ₹8.08 lakh Cr, reflecting long-term value creation💡 Key Insight:
Strong premium growth + stable profitability + robust solvency position keeps SBI Life structurally मजबूत in the insurance space.
#sbilife #research #fundamentalanalysis #technicalanalysis #priceaction #TradingMindset #trading
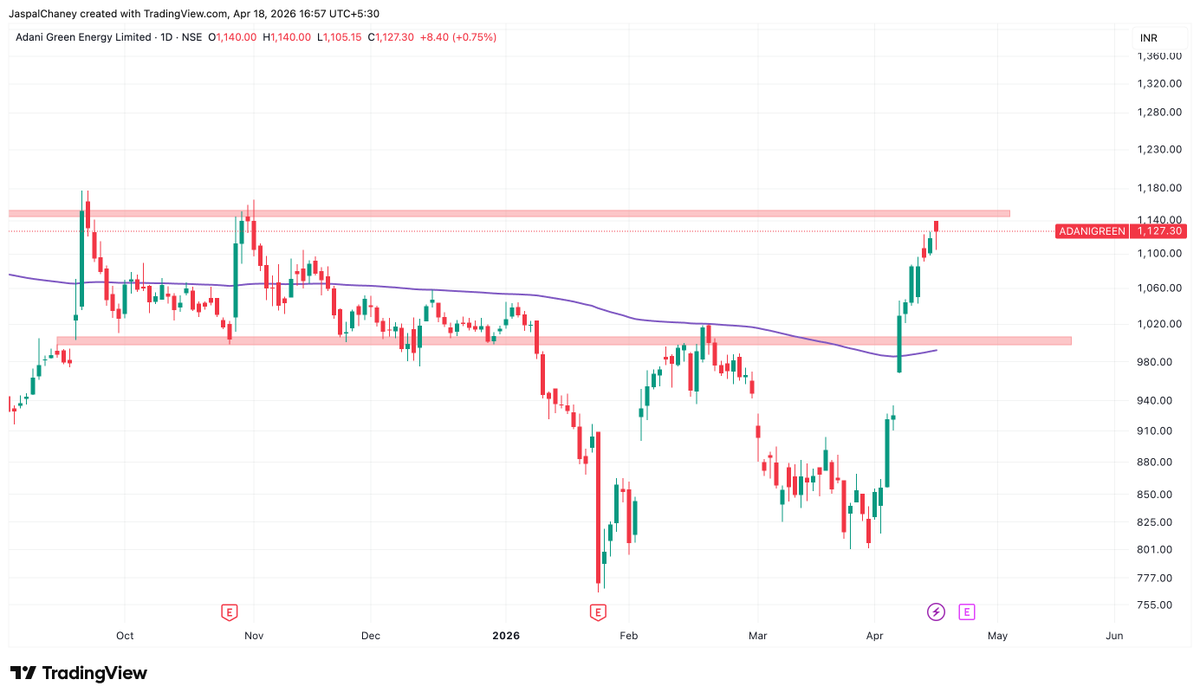
📊 Adani Green – At Key Resistance (Daily TF)
Adani Green is showing strong momentum after a sharp rally from ~820 levels, but now price is approaching a crucial supply zone near 1120–1140, which has acted as resistance multiple times in the past. This makes the current zone a key decision area for the next move. The recent impulsive rally indicates strong buying interest and a possible shift in sentiment, especially as price has also reclaimed its moving average after a long period, hinting at early signs of strength returning. However, this resistance zone cannot be ignored as sellers have previously been active here.
If price manages to break and sustain above 1140, we could see continuation of the uptrend with fresh momentum. On the other hand, any rejection from this zone may lead to a pullback or consolidation, with immediate support placed around 1000–1020, which also acts as a strong demand zone and previous breakout base. As long as price holds above this support, the overall structure remains bullish.
💡 Educational Note: Markets often react at previous supply zones, and instead of predicting direction, it’s always better to wait for confirmation before taking a position.
⚠️ This is for educational purposes only, not a buy/sell recommendation.
#stockmarkettrading #priceaction #adanigreen #research #stockmarket
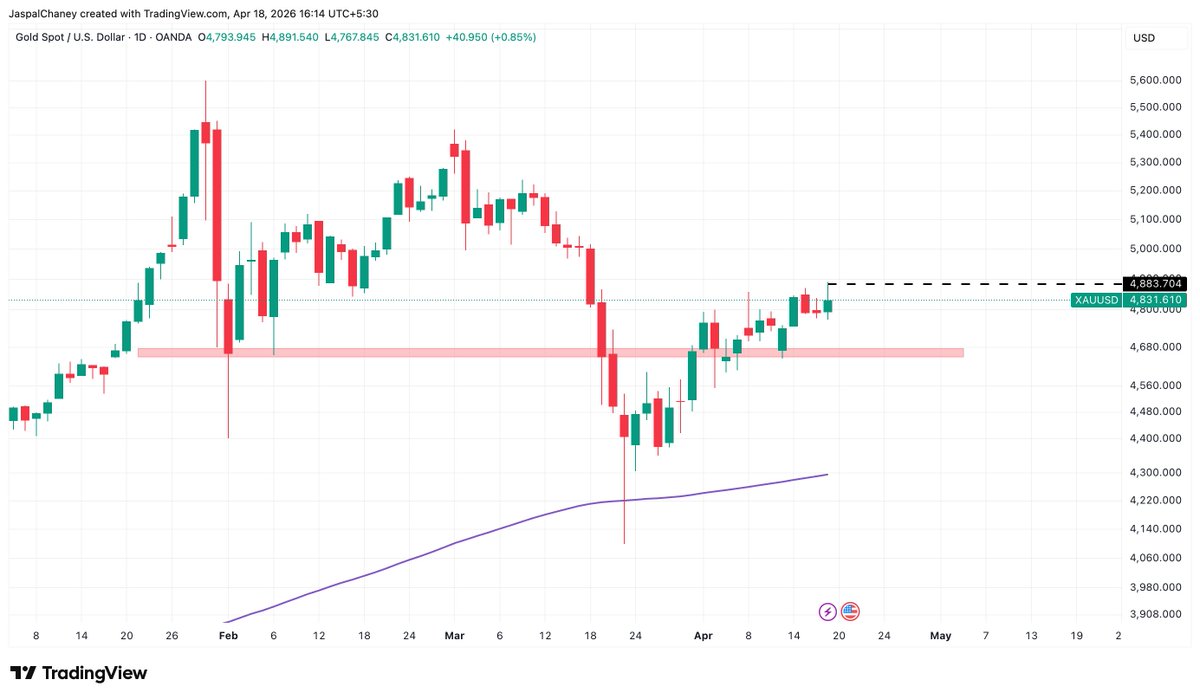
📊 Gold (XAUUSD) – Structure Breakdown (Daily TF)
Gold is showing a recovery after a sharp correction, but the structure is still interesting here 👇
🔹 Trend Insight:
After a strong uptrend, price gave a deep pullback and is now attempting to stabilize.
🔹 Key Observation:
Price is currently trading in a range between ~4680 – 4900 zone
→ This is a classic re-accumulation / consolidation phase
🔹 Support Zone:
🟢 4600 – 4650
Strong buying seen after the sharp sell-off
🔹 Resistance key level:
🔴 4900
Multiple rejections → supply still active
🔹 Moving Average (Dynamic Support):
Price is holding above the rising MA → indicates higher timeframe bullish bias intact
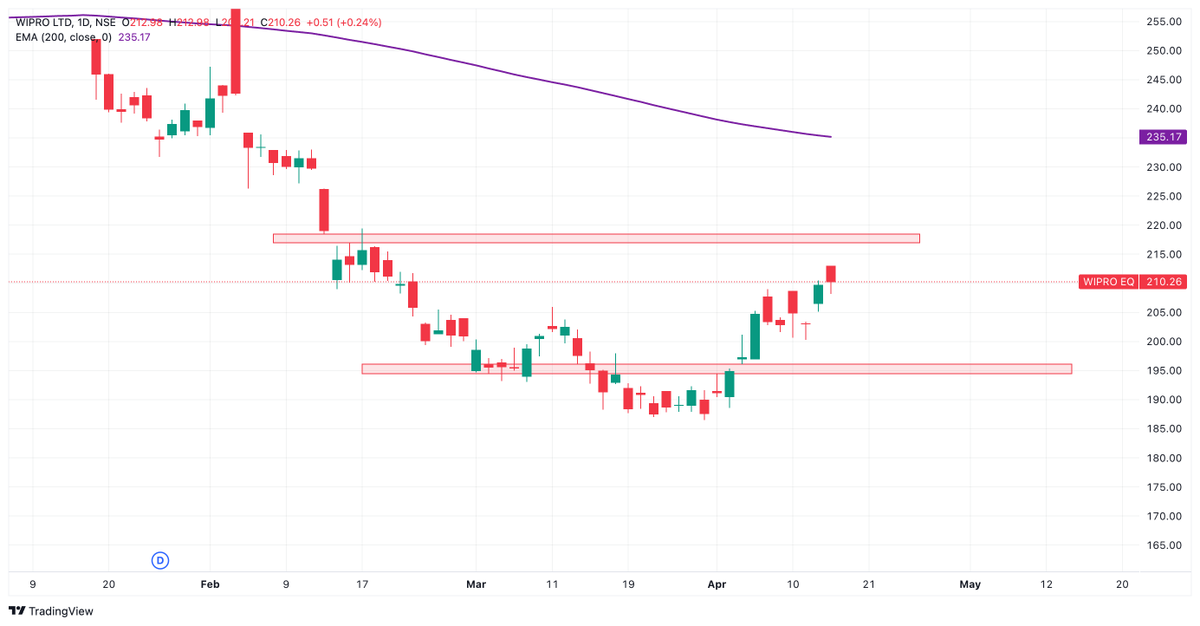
WIPRO – Technical + Fundamental View
Stock has been in a strong downtrend (lower highs & lower lows) and is still trading below 200 EMA → bearish structure intact
📌 Current Zone: ~210
👉 218-220: Supply / resistance zone
👉 195–190: Demand zone (recent bounce area)
Price is currently in a pullback phase inside a broader downtrend
→ Until structure changes, rallies can face selling pressure
🧠 Important Context:
Wipro has announced a ₹15,000 Cr buyback at ₹250 (~19% premium)
This may support sentiment, but price action is still weak technically
🎯 What to watch:
→ Acceptance above resistance = possible trend shift
→ Rejection = continuation of downtrend
For educational purposes only. Not a recommendation.
#stockmarket #stockmarketindia #trading #wipro #priceaction #research
HCLTECH – Compression Before Expansion? 📊
HCL Tech is currently trading inside a well-defined range, and price is now testing the range high (~₹1400–1415).
📦 What’s happening?
– Clear consolidation between ₹1310 – ₹1400 zone
– Multiple rejections from both boundaries → strong equilibrium
– Recent move shows buying interest near highs
📊 Structure Insight:
– After a prior downtrend, price is now building a base
– Range highs being tested again → potential breakout pressure building
🧠 Learning:
“The longer the range, the stronger the breakout.”
But confirmation matters — wait for acceptance, not just breakout candles.
Patience > Prediction.
#priceaction #optionstrading #stockmarketindia #research
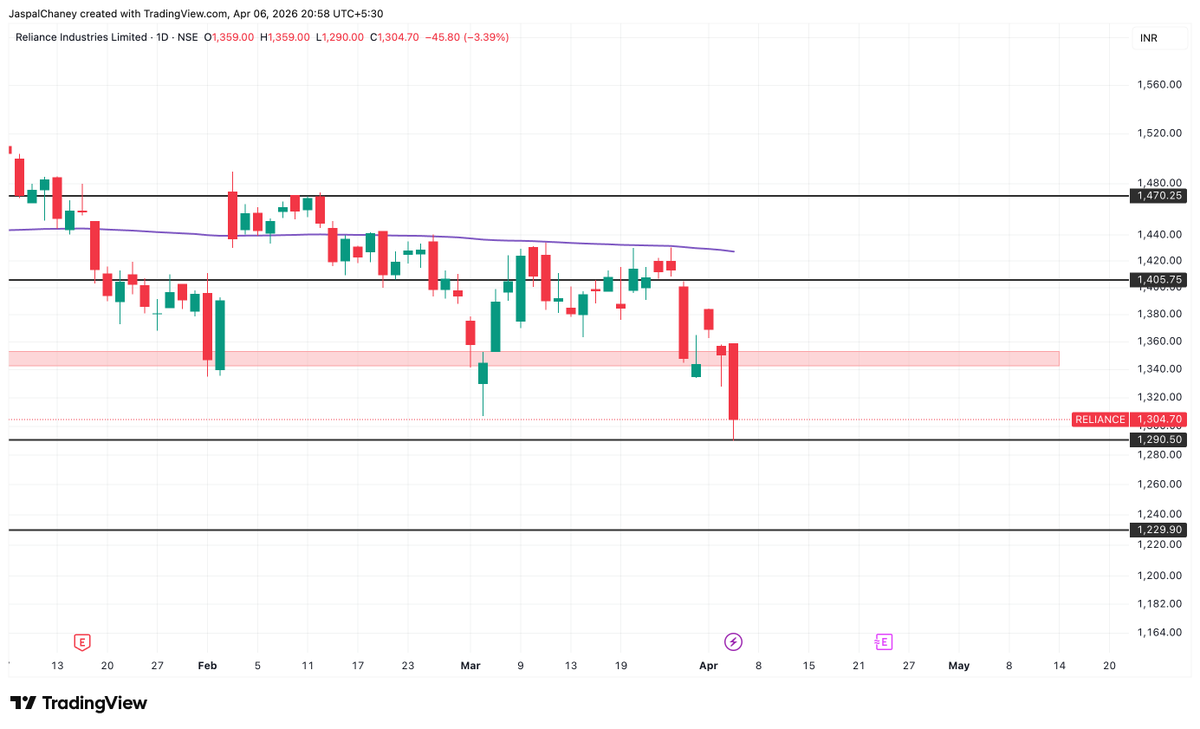
RELIANCE – Price Action Breakdown (Educational)
Reliance is currently showing clear weakness after losing a key demand zone.
�� What just happened?
– Price broke below the ₹1340–1350 demand zone (highlighted area)
– Strong bearish candle with follow-through → indicates supply dominance
📊 Structure Insight:
– Lower highs + fresh breakdown = continuation of downtrend
– Price is now approaching a critical support near ₹1290
⚠️ Important Zones to Watch:
– Support: ₹1290 → If this fails, next leg lower possible
– Resistance: ₹1340–1350 → Now likely to act as supply on pullback
🧠 Learning Point:
“Demand once broken often becomes supply.”
Always observe how price reacts on retests rather than predicting reversals.
No assumptions. Just reaction to price.
#priceaction #research #stockmarketindia
V-Mart Retail showing a classic trend reversal attempt 👀
After months of downtrend, price has:
✅ Broken descending trendline
✅ Reclaimed supply zone (~560)
✅ Strong bullish impulse candle with volume
This move is backed by fundamentals too — strong Q4 update, revenue growth ~24% YoY & aggressive store expansion
⚠️ But context matters:
• Still below higher timeframe resistance
• Long-term trend not fully reversed yet
📌 Key levels to watch:
→ 560–580: Flip zone (support now?)
→ 650+: Next supply
→ 740+: Major resistance
If price sustains above breakout → momentum continuation possible
If fails → could turn into bull trap
From breakdown to breakout — now comes the real test.
#stockmarketindia #trading #reserach #vmart #priceaction #swingtrading
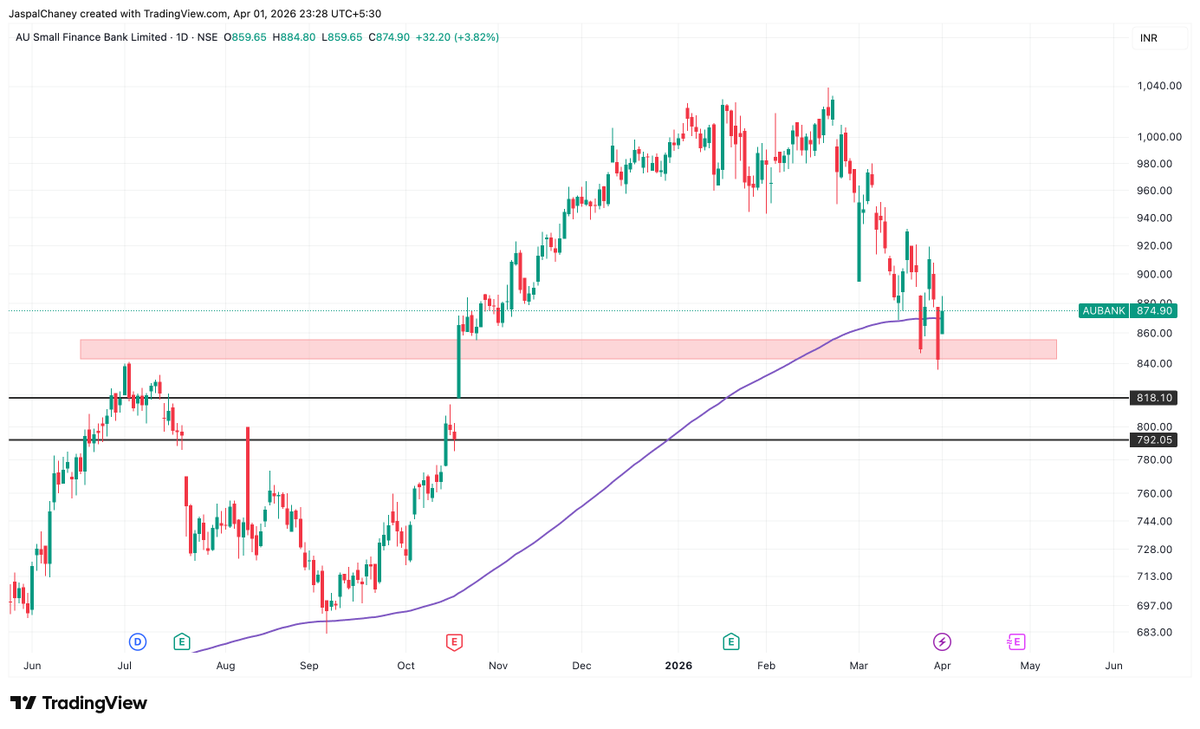
AU Small Finance Bank at a critical juncture 👀
After a strong uptrend, price has seen a sharp correction from ₹1040 levels and is now reacting near a key demand zone around ₹840–860.
Key observations:
• Strong rejection from highs → momentum cooling
• Price testing previous breakout zone (now demand)
• Trading around 200 DMA → crucial support area
• Volatility expansion → potential trend decision phase
Structure-wise, this looks like a pullback within a larger uptrend, but confirmation is key.
👉 Holding this zone could lead to stabilization
👉 Losing it may open downside levels
Patience > Prediction in such zones. Let price confirm.
#stockmarketindia #stockmarket #trading #priceaction #research
Adani Energy Solutions is at an interesting spot 👀
After facing rejection near ₹1040–1050 resistance, price is now testing a key demand zone around ₹940–960.
Multiple rejections from resistance → supply clearly active
Price hovering near 200 DMA → make-or-break zone
Range forming between ₹900 – ₹1040
Despite short-term weakness, broader structure still looks like range-bound consolidation, not a breakdown yet.
👉 A decisive move outside this range will likely define the next trend.
#stockmarketindia #trading #priceaction #adanienergy #research
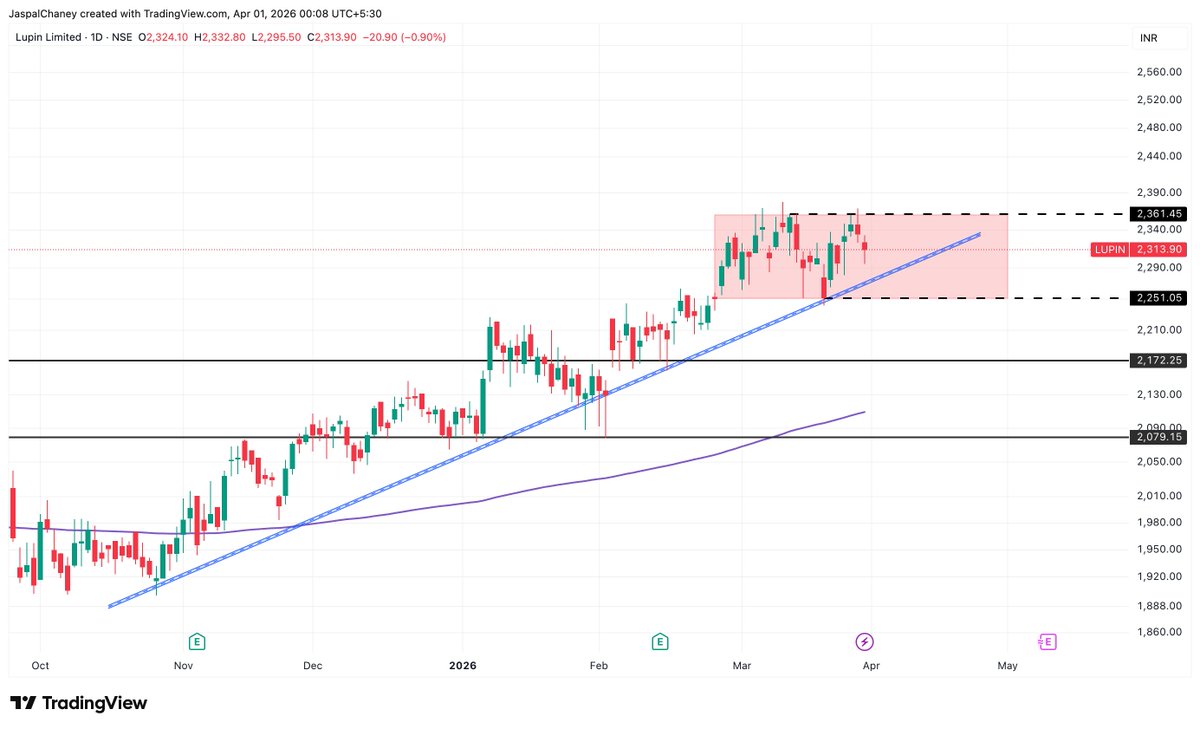
Lupin (Daily Chart) – Understanding Consolidation 📊
Interesting structure developing here from a price action perspective:
• Strong uptrend intact with a clear sequence of higher highs & higher lows
• Price is now consolidating within a defined range (~2250–2360 zone)
• Rising trendline continues to act as dynamic support
• Horizontal resistance near the top of the range is being respected multiple times
• Volatility contraction inside the range suggests potential energy build-up
Key learning:
After a strong move, markets often pause in a range. This phase is where institutions accumulate/distribute before the next directional move.
Focus on how price behaves near range boundaries rather than predicting direction.
No bias, just observing structure.
#stockmarketindia #lupin #priceaction #TradingMindset