Keep this in mind:
When Gold rallies, it's a warning.
When Silver rallies, it's fear.
Investors are not chasing growth, they're chasing protection, and you need to really understand this.
Metals are safe havens, not growth investments. They're factor of protection against issues happening in the market right now.
There's a big unclear, unseen flow in the market at the moment. A big crack is coming, a black swan event or whatever you wanna call it.
Everything is pumping and that's not a bullish sign especially in these market conditions.
I am not trying to be the bad person who doesn't want people to feel happy with the rally, but I am here to warn you.
What we saw yesterday is very bad. and am not talking about CPI.
Am talking about Jerome Powell and Trump situation.
Imagine hearing Jerome Powell on TV asking for people's help in what's happening with Trump and the government charging him for criminal acts, that's the end of the economy.
In brief, Trump wants Jerome Powell gone to replace him with another Federal Reserve Chair, and Trump is going crazy in everything, started with Iran Israel and all that shit wars then Maduro and bombing Venezuela, then Greenland etc etc.
What Trump is doing to Jerome Powell is just to scare the new Chair showing him who is really in power and who he needs to fear most. Although the Fed Chair Role is to maintain US Economy from inflation and collapsing, Trump is clearly showing he wants inflation to stay high enough to make the poor poorer and the rich richer. Trump's decisions are beyond US, they will affect everything even us.
This is the main reason for the gold's and metals rally.
In terms of Crypto, ofc they're at risk, only Bitcoin will stay King. This is why Micro-strategy and other companies are buying only BTC. Really when did we hear them buying something else? Even ETH (although i like ETH and it has potential)
Call me crazy but yes Gold is still cheap (cheaper than future price) BTC will crash yes but it will be the last chance to buy below 100k.
This is not a financial advice am not saying to buy now, prices are high but they can go higher.
Do Your Own Research.
#ANALYSIS
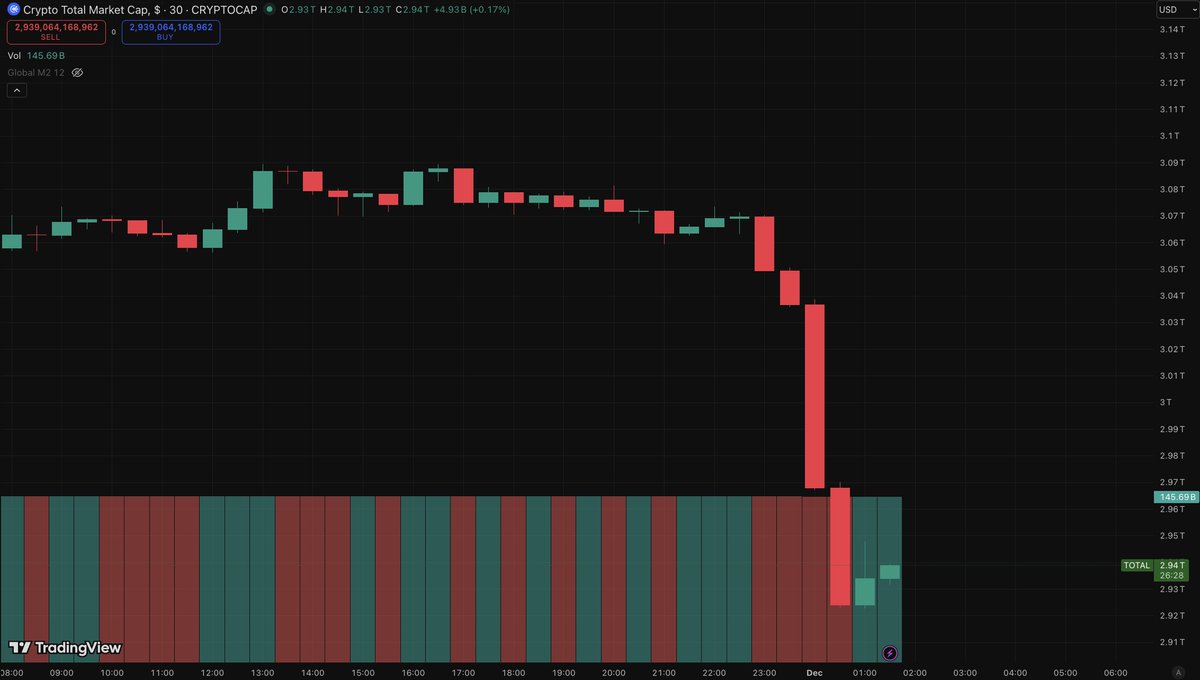
TOTAL CRYPTO MARKET CAP - 3Day TF
The total crypto market cap is currently sitting on a critical ascending trendline around $2.9T, a level that has held multiple times in the past but is now showing clear signs of exhaustion. Each previous bounce from this trendline produced weaker follow-through, suggesting this is no longer healthy trend continuation but late-cycle distribution.
While a short-term relief bounce toward $3.4T–$3.6T is still possible, the lack of momentum and overlapping price action point to indecision rather than strength.
From a liquidity perspective, the more a support is tested, the weaker it becomes, increasing the probability of a breakdown. A confirmed loss of this trendline would likely open downside toward $2.6T first, and potentially $2.2T–$2.0T later, aligning with the broader thesis of prolonged sideways action followed by deeper downside before a true macro bottom forms.
#crypto #totalcryptomarketcap
#ANALYSIS#UPDATE
$BTC
Bitcoin has been in a bear market since September, with the full bottom expected to take 12–14 months, likely forming around the $60k region. In the short term, BTC is expected to move sideways for weeks, potentially pushing up toward $97k–$107k before the final leg down, with no major downside expected before Feb–Mar 2026. This prolonged range is designed to build liquidity and exhaust traders psychologically, not to move fast.
The strategy outlined is short-term bullish, long-term bearish: holding BTC for a potential upside while keeping shorts open as a hedge.
On the macro side, markets are in a severe liquidity crisis, comparable to or worse than 2008, with banks surviving due to the Fed’s Standing Repo Facility, which provides short-term liquidity but does not equal money printing. The system remains fragile, inflation and debt are not under control, and a major crisis is expected in 2026, followed by renewed large-scale money printing similar to 2020—eventually pushing all assets (including BTC, gold, and real estate) higher while fiat loses value.
Liquidity & Key Zones
- The blue zones marked as Support acted as distribution-to-displacement zones. Once broken, they accelerated downside, confirming liquidity had already been engineered.
- The FVG (Fair Value Gap) around ~74–76k stands out as a major magnet — this aligns with the expectation of a deeper retracement before the true macro bottom near ~60k later in the cycle.
- The range between ~88k–100k is a liquidity compression zone, ideal for manipulation and fake directional moves.
Scenario Alignment
- Scenario 1 (Less likely to happen): Breakdown toward ~76k, followed by continuation lower over time.
- Scenario 2 (Distribution): Failure near resistance leads back into range, reinforcing sideways price action designed to build downside liquidity.
- Scenario 3 (Short-term bullish): A controlled bounce toward ~100k–107k fits the thesis of a final upside liquidity grab. This would likely be slow, choppy, and emotionally exhausting — not a clean impulsive rally.
The key takeaway:
Be patient, avoid over-trading, and understand that time and liquidity matter more than speed.
#Bitcoin #crypto
#ANALYSIS - Weekly Report is here!
#BTC Daily TF $BTC #Bitcoin
BTC is likely to move sideways for the rest of December, followed by a small impulsive push at the beginning of January — a move that will convince many traders that the bull market is back simply because it’s a “new year.” This is exactly the type of sentiment market makers exploit.
Our primary scenario remains intact: a move into the 98k–103k liquidity zone, with a possible fake breakout extension toward 107k, acting as pure exit liquidity before the real move begins. From there, Bitcoin is expected to roll over aggressively, with 2026 Q1–Q2 targeting the 60k region, potentially printing wicks as deep as 58k–55k, which would likely mark the cycle bottom.
While no bottom can ever be guaranteed, this zone aligns with high-probability liquidity, structure, and historical behavior.
Before reaching it, expect a heavy dump → consolidation → continuation lower sequence. Key levels to watch on the way down are 76k–75k, 70k–74k, 66k, and finally 60k.
Don’t say you weren’t warned by The Crypto Lady.
The Shocking Truth Behind #Gold’s Path to $5,000
We’re living through a silent monetary reset, where global debt has exploded past $315 trillion, the U.S. dollar is backed only by debt and trust, and both are rapidly eroding.
Since the gold link was severed in 1971, currencies have inflated relentlessly while hard assets stayed real, which is why central banks bought a record 1,037 tons of gold in 2023—they’re preparing, not guessing.
Every major reset in history, from Bretton Woods to the end of the gold standard, destroyed one system and built another, and the next one will be digital.
As nations like China, India, and Russia move away from the dollar and shift toward gold-backed settlement systems, economic power is also shifting east.
With global money supply up 10x since 2008, gold would need to reprice to $5,000–$7,000 just to balance the expansion, and the gold-to-silver ratio suggests silver could surge as well. Even moderate inflation destroys purchasing power—3% inflation wipes out 26% of your cash in a decade—while gold supply grows only 1.5% annually.
That’s why the wealthy are positioning in hard assets and leveraging automation to stay ahead as the financial system resets.
#Bitcoin Weekly TF
#BTC’s weekly chart is repeating the same macro topping structure as 2021, with a rounded top, distribution, and a clear break of major support, confirming a shift into a bearish trend.
After rejecting the 2025 supply zone, price is now forming a small relief channel or bear flag, which typically breaks down in continuation of the dominant trend. Unless BTC reclaims the broken weekly support, the next high-timeframe target sits near the 75k demand zone, and if that fails, the deeper 55–60k OB becomes the major macro support.
Overall, the weekly structure remains bearish, and current price action suggests this correction is not yet complete.
BTC can still push toward the 98k–105k zone, but this move would likely act as the final retest of resistance and a liquidity grab rather than a true trend reversal. If price reaches that region, it would simply offer Bulls their last opportunity to offload positions at the top before the major high-timeframe breakdown continues. Any rally into that range should be treated as exit liquidity, with smart money preparing cash for deeper dips that follow the macro bearish structure already forming.
🚨Last #FOMC decision of the year TONIGHT
The #Fed will close the year with one final word.
Will it shake the markets or steady them?
👇What do you think🤔💭
#UPDATE
$BTC Weekly TF
Bitcoin’s weekly structure continues to lean heavily bearish despite the temporary bounce. The chart shows a clear breakdown from the mid-term market structure, and price is currently retesting broken support levels from below — a classic bearish continuation setup on higher timeframes.
First, BTC has already lost a major weekly support zone and is now trading under both the 21 EMA and the 50 EMA. Historically, when Bitcoin loses the 50 EMA on the weekly timeframe, it signals a shift from a bull to a bear phase. This breakdown also came with strong volume, suggesting real selling pressure rather than a simple wick.
We are also forming lower highs and lower lows, confirming a bearish trend on the weekly structure. The previous support area around $100K–$102K has now turned into resistance, and unless BTC reclaims this zone with a weekly close above it, sellers remain fully in control.
The weekly candle structure shows indecision around broken support, which often leads to continuation to the downside once the retest completes.
On top of this, Bitcoin still has an unfilled Fair Value Gap (FVG) between $73,000 and $75,000, which remains a high-probability magnet. Every cycle, BTC eventually fills large weekly FVGs before finding a major bottom. The current trajectory on the weekly chart naturally points toward that zone, especially with the trendline channel pointing lower and the higher lows structure now invalidated.
If the relief bounce continues, it may retest $93K–$100K as a rejection zone before another leg down. But the weekly trend remains bearish until BTC breaks above $102K and holds there.
#BITCOIN MAJOR UPDATE
Bitcoin just printed a nice leg up, which fits the definition of a relief rally rather than a trend reversal.
For bullish momentum to truly accelerate, BTC needs to break $91,500 and then reclaim the previous major sell-side liquidity at $93,000.
It may even wick into the 21 EMA on the daily around $94,000, but what really matters is a daily close above these levels—only then can we say the move from $80.6K might have been a bear trap.
According to the daily timeframe, BTC could even reach $100K, where price meets the 50 EMA, but that would still likely be a retest before another leg down (maybe not :p).
Despite the recent bounce, the RSI is still below the 50% mark, which means momentum hasn’t shifted bullish yet.
In brief, this pump still looks like a relief rally, not a confirmed trend reversal, at least in my opinion.
I expected a bounce here anyway since we’re heading into monthly close and the last week of the month often brings volatility.
If #BTC is pumping now, it might even lead to a red weekend, but that’s just a thought.
Also worth noting: the #PPI report on Tuesday came in largely as expected, supporting market expectations that the FED could cut interest rates sooner, which may be contributing to this short-term upside reaction.
#Bitcoin: After two straight months of bull liquidations and constant downside move, markets show the bulls some mercy and punish the late shorts. This is just another trap before the next and bigger leg down