i've been running this regime-based trading for months and it's the single reason my strategies survive when markets shift
here's how to build regime-based trading that actually adapts:
---------------
1. define your regime signals: pick 5-6 that actually predict shifts.. Hurst exponent on your universe, VIX term structure, realized vs implied vol spread, cross-asset correlation matrix, credit spreads, rates curve slope.. write them into a signals.md file
2. build the classifier: a scheduled job that pulls fresh values every 4 hours, compares each signal to its rolling 90-day distribution, flags anything in the top or bottom decile, then outputs one line.. current regime is trending, mean-reverting, high vol, or crisis
3. give it a strategy mapping: "tag every strategy in your book with the regimes where it actually works. stat arb needs mean-reverting, momentum needs trending, vol selling needs low vol and dies in crisis".. now every strategy knows when it should be live
4. add the resizing agent: same loop but pointed at every open position.. current regime vs strategy's favored regime, current sizing vs Kelly-optimal for that regime, correlation with the rest of the book.. tells you exactly which positions to scale up, cut, or hedge
5. everything writes into context files inside my strategy folder: current-regime.md, regime-history.md, position-adjustments.md.. every strategy reads them before entering or resizing anything
the KILLER part: this plugged straight into my kill switch layer so when the regime flips to crisis, the system pulls risk automatically before i even wake up
a regime shift used to mean 3 hours of manual research and usually a missed exit
now the classifier flags the shift within 4 hours and my book auto-adjusts before the loss compounds
the highest-leverage tool in trading is not a better strategy
it's the system that tells you when your current strategy is about to stop working
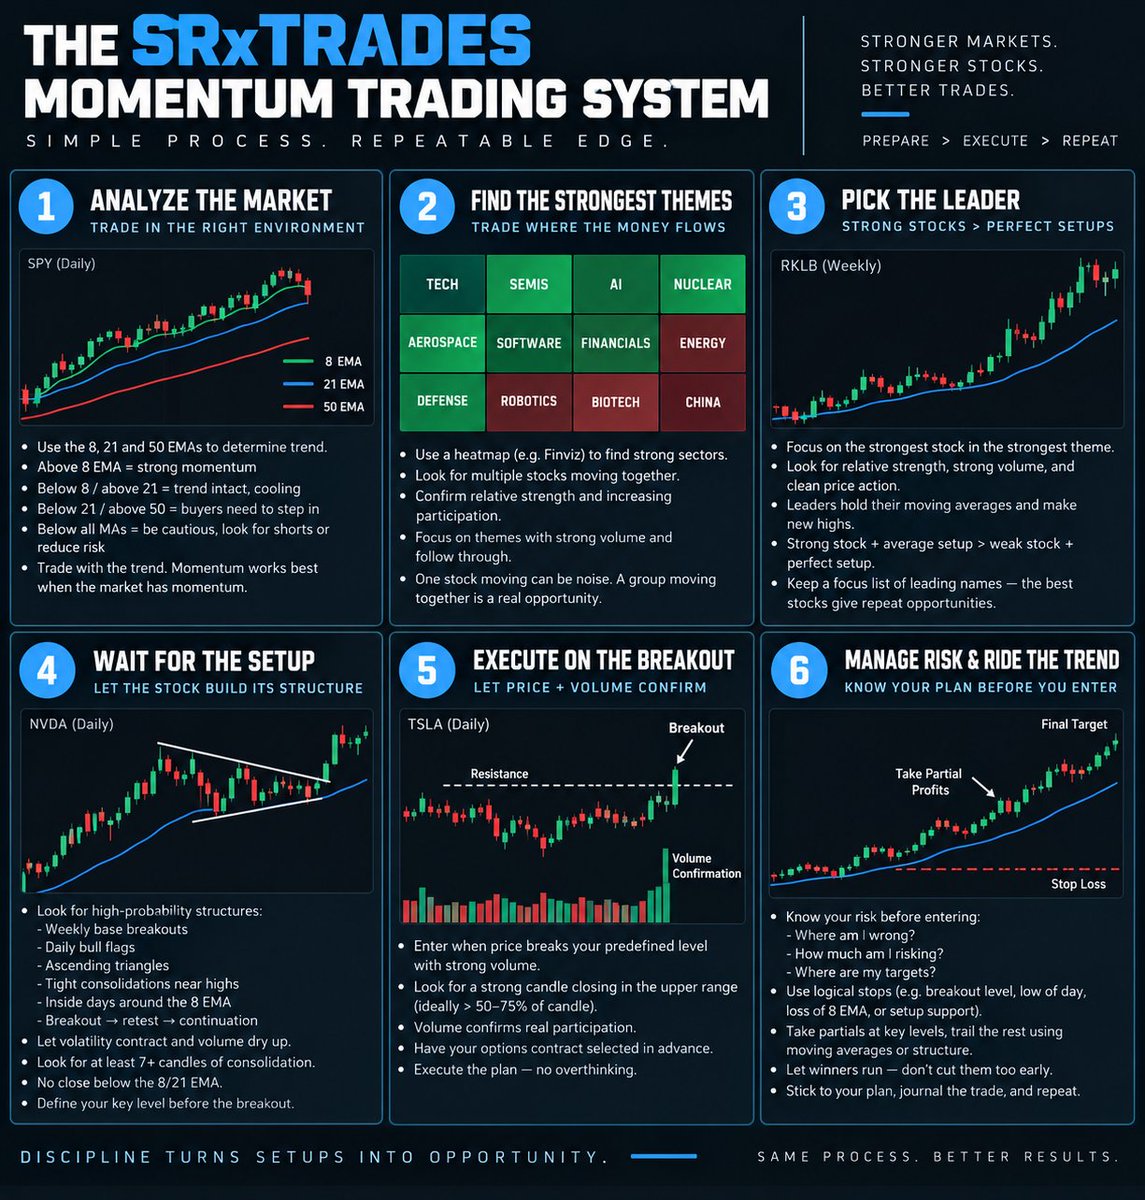
Here is a full breakdown of the momentum trading system I use to find and trade some of the strongest stocks in the market:
The strategy itself is actually pretty simple
I’m not trying to predict what every stock is going to do
I’m trying to identify where momentum already exists
THEN
Wait for a high-quality setup to form, and from there position myself when price + volume confirm the move.
My process can be broken down into 6 steps:
Market → Theme → Leader → Setup → Trigger → Risk
Here’s exactly what I’m looking for:
STEP 1: START WITH THE MARKET
Before I look at an individual stock, I want to know what environment I’m trading in.
This is probably one of the most overlooked parts of momentum trading.
You can find the best-looking breakout in the world…
But if the entire market is weak, choppy, or losing momentum, the probability of that breakout following through is naturally going to be lower.
I use the 8, 21 and 50 EMAs as a simple framework for understanding trend.
Generally:
• Above the 8 EMA = strong momentum
• Below the 8 / above the 21 = trend intact, but momentum is cooling
• Below the 21 / above the 50 = trend may still be intact, but buyers need to step back in
• Below the major moving averages = much less interested in forcing longs
The goal is to understand:
Is this an environment where my strategy should have an edge?
Momentum strategies work best when there is momentum.
Simple.
STEP 2: FIND THE STRONGEST THEMES
Once I understand the market environment, I move down another layer.
I want to know:
Where is the money actually flowing?
Markets move in themes:
AI
Semiconductors
Nuclear
Crypto
Space
Software
Financials
Whatever it happens to be at the time.
When an entire group starts moving together, I pay attention.
I'm looking for sectors/themes displaying:
• Relative strength
• Multiple stocks breaking out
• Strong volume
• Stocks holding their moving averages
• Continuation after breakouts
• Increasing participation across the group
The theme is more important than a setup
Id rather trade a C setup in the best group/stock in the market than A+ setups in the worst group...
When multiple stocks within the same theme start moving together, that's much more interesting.
This is why I don't start my process by randomly scrolling through charts looking for patterns.
I want to know where the strength is first.
STEP 3: FIND THE LEADER
Now that I know the strongest areas of the market, I want the strongest stocks inside those areas.
This is one of the most important concepts in my entire strategy:
Strong stock + average setup > weak stock + perfect setup.
The chart pattern matters
BUT
The STOCK matters more.
I'm looking for names that are:
• Above their key moving averages
• Showing relative strength
• Trading with strong liquidity
• Attracting above-average volume
• Breaking out while other stocks struggle
• Holding up well during market pullbacks
• Leading their respective theme
These are the stocks I want to repeatedly keep on my focus list.
Leaders tend to continue acting like leaders until the market proves otherwise.
You don't need 100 stocks.
Sometimes the same handful of names will provide opportunity after opportunity.
STEP 4: WAIT FOR THE SETUP
Finding a leader doesn't mean immediately buying it
Now we wait....
This is where patience comes into the system
I'm looking for the stock to give me a clean structure where I can define:
Entry → Risk → Target
Some of my favorite structures are:
• Weekly base breakouts
• Daily bull flags
• Ascending triangles
• Tight consolidations near highs
• Inside days around the 8 EMA
• Breakout → retest → continuation setups
The best momentum stocks often move like staircases:
Expansion → consolidation → expansion → consolidation → expansion
After a strong move, I want to see the stock digest that move constructively.
Ideally:
-Price gets tighter.
-Volume gets lighter.
-The stock respects the 8/21 EMA.
-Selling pressure decreases.
-Very obvious trigger forms
STEP 5: LET PRICE + VOLUME TRIGGER THE TRADE
Once everything above starts setting up, execution should become the easiest part...
I've already done the work:
I know the environment
I know the theme
I know the stock
I know the weekly chart
I know the daily setup
I know my level
Now I'm waiting for price to prove me right
For a breakout, I'm generally looking for:
Price breaks the predefined level + volume confirms the move.
Volume is extremely important here.
A breakout tells me price is moving.
Volume tells me there is actual participation behind that move.
STEP 6: DEFINE THE RISK BEFORE YOU ENTER
This might be the most important step...
Before I enter ANY trade, I should already know:
1. Where am I wrong?
2. How much am I risking?
3. Where are my targets?
Not after entering.
BEFORE.
My stop should be based around a logical technical level near the setup.
Depending on the structure, that could be:
• Loss of the breakout level
• Low of day
• Loss of the 8 EMA
Its usually break under low of day, that invalidates the trade
This keeps my risk extremely TIGHT
Then I want targets based around areas price has previously respected.
Previous highs.
Supply.
Major weekly levels.
Extension areas.
And as the stock continues trending, moving averages can help manage the remaining position.
The objective isn't:
"How much can I make?"
The first question is:
"How much am I willing to lose if I'm wrong?"
Once you genuinely accept that number before entering, execution becomes much easier
That's essentially the system.
Not 25 indicators
Not predicting bottoms
Not chasing whatever ticker is trending on social media
Not taking every breakout I see
I'm continuously filtering:
MARKET
↓
STRONGEST THEME
↓
STRONGEST STOCK
↓
A+ WEEKLY/DAILY STRUCTURE
↓
DEFINED TRIGGER
↓
VOLUME CONFIRMATION
↓
PREDEFINED RISK
↓
EXECUTE
Each filter removes lower-quality opportunities
For me:
Market conditions → Themes → Leaders → Setups → Volume → Risk → Execution.
Master those pieces.
Then repeat them until they become boring.
That's what a trading system is supposed to be.
Most traders use ATR for one thing.
The stop loss.
That is the weakest way to use it.
ATR can run the whole breakout strategy.
Entry
> Open of the bar + 2.5 × ATR(20)
> A hard price. It gets hit, or it doesn’t.
Filter
> Short-term ATR vs long-term ATR
> Short-term below long-term = the market is coiling. Take the breakout.
> Short-term above long-term = already expanding. Sit out.
Exit
> Use a fraction of ATR as the stop distance
> The market decides how much room the trade needs
Same measurement in all three places:
how much the market is actually moving.
If you only use ATR for the stop, you are leaving the other two jobs unused.
What do you currently use ATR for?
🚨 INSIDERS DON’T WANT YOU TO SEE THIS
This was never meant for retail.
But I’m done watching people get liquidated by systems designed to extract their money.
There are 4 models insiders use over and over again.
Once you see them, price action will never look the same.
1. THE STOP HUNT
Nothing moves until liquidity is taken.
Price gets pushed into obvious highs or lows.
Stops get triggered.
Weak hands get wiped out.
Only after retail is forced out does the real move begin.
If you entered before the sweep, you weren’t early.
You were the liquidity.
2. THE TRAP
This is where even experienced traders get caught.
Price shifts structure.
Everything looks confirmed.
Retail enters.
Then insiders push price one more time in the opposite direction and sweep the remaining liquidity.
Only then does the real move start.
The first confirmation was never for you.
It was bait.
3. THE INSIDER ENTRY
Insiders don’t chase price.
They wait for price to come back to them.
The key zone:
0.62-0.79 retracement.
When a fair value gap sits inside that area, that’s where size starts entering.
Retail buys the breakout.
Insiders buy the retracement.
That difference is everything.
4. THE RANGE TRAP
Price goes sideways until retail loses patience.
Then comes the fake breakdown.
Stops get taken.
Liquidity gets collected.
Price snaps back into the range.
And expansion begins.
Retail thinks the breakdown failed.
Insiders already got what they came for.
This is what most traders never understand:
Price does not need to move far to take your money.
It only needs to know where your liquidation is.
That’s why the same patterns keep repeating.
Stops. Liquidity. Trap. Expansion.
Billions move through these structures while retail stares at indicators.
Bookmark this.
Study every model.
Because once you understand how insiders hunt liquidity, you stop looking at charts like retail.
You start looking at them like the people taking retail’s money.
For context: I’ve been trading markets for 20+ years.
I’ve seen every kind of bubble, crash and liquidation.
I only care about the moves that matter.
When the next one comes, my followers will see it first.
Follow and turn notifications on.
You won’t get a second warning.
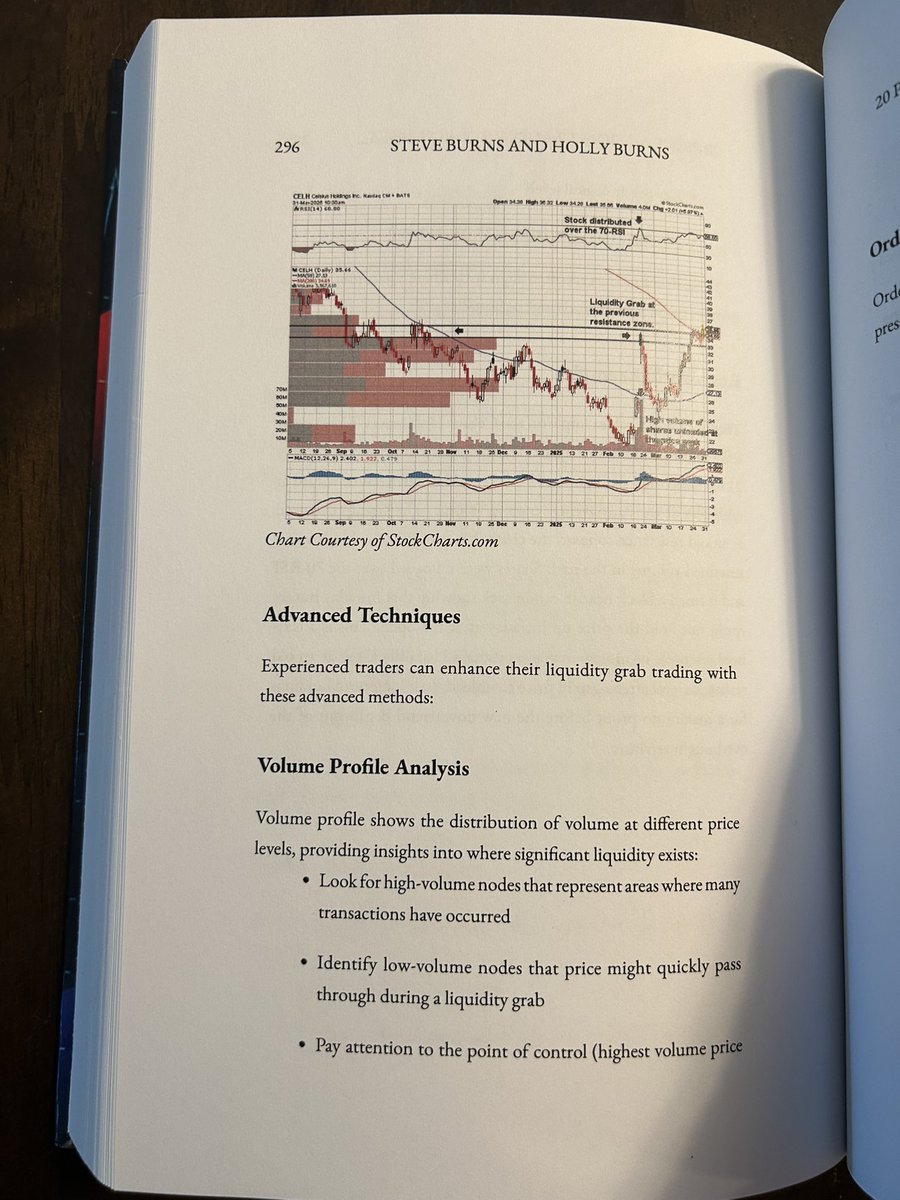
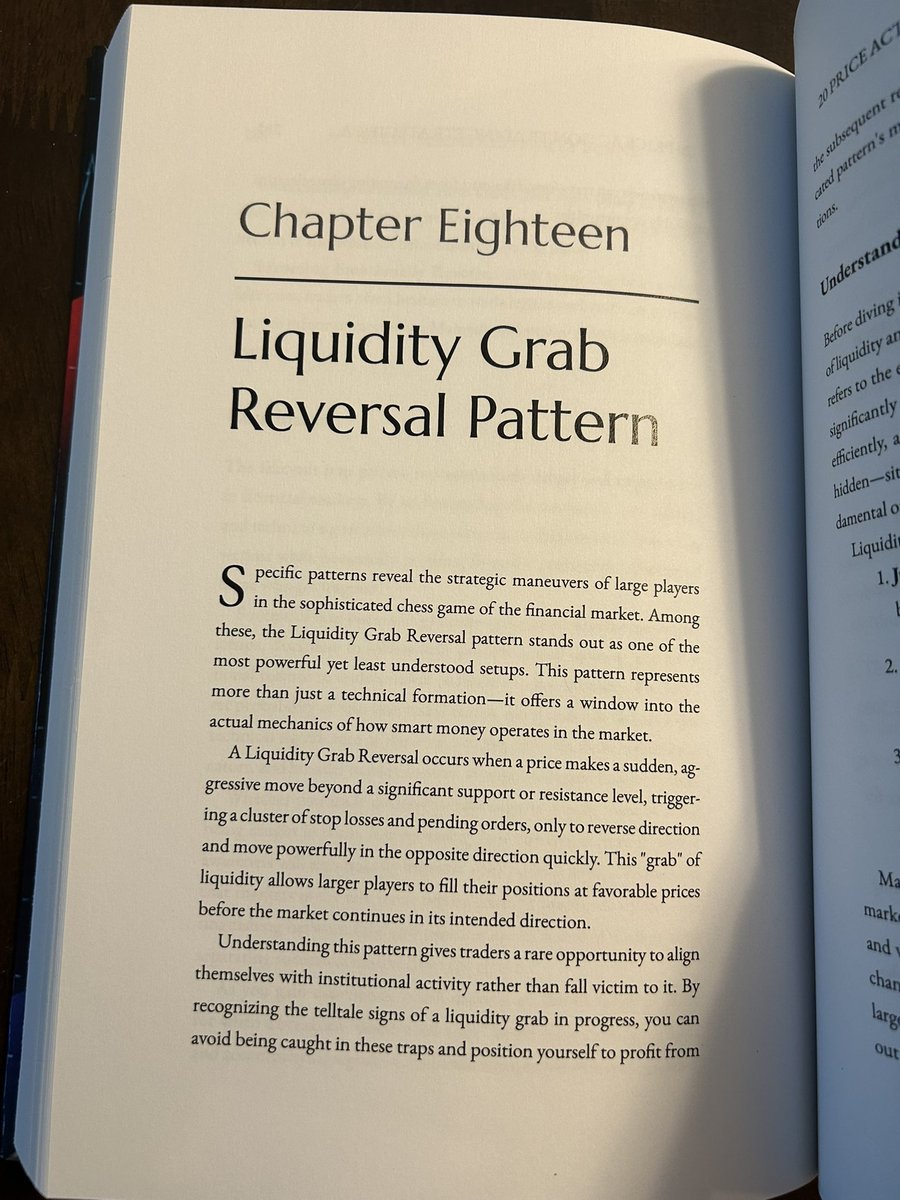
The Liquidity Grab Explained:
Book title: 20 Price Action Trading Strategies: A Technical Analysis Guide: Unlock the Secrets of Market Movements:
Amazon US book link: https://t.co/u4WOdakWy6
1/3 🧵
To my right is Kelvin Chiu — the first Hong Kong trader to be featured in the Market Wizards series.
I had the pleasure of meeting him in Singapore today and having lunch together. (Photo posted with Kelvin’s permission. He also knows that I use the J Law avatar on social media.)
If you’ve read the newly released Market Wizards: The Next Generation, you’ll know that Kelvin grew up in Hong Kong, graduated from Cambridge, and went on to work at Goldman Sachs and Vitol, one of the world’s largest energy trading firms. During his proprietary trading years at Vitol, his best year generated $35 million in profits.
After leaving Vitol and trading his own capital, he compounded at 108.7% annually for 7 consecutive years, with a Sharpe Ratio of 2.0. Today, he focuses on his own family office.
So when you sit down with a trader like this, naturally I was ready to pull out my notebook and ask him everything I could about trading and asset management.
Instead, our conversation started with… our kids’ education. 😂
Long story short, here are some of the biggest takeaways I got from both his interview in the book and our lunch conversation today:
@KC_SilverCape@Clement_Ang17