"📊 #Bitcoin $BTC holding above EMA ($105,425) after📈
Daily RSI at 54.42,
MACD bearish crossover signals caution, but 50-day EMA ($100,852) & 200-day SMA ($91,258) support bullish trend.
Key support: $101,400-$100,600. Resistance: $108,000-$112,000.
🚀 Eyeing $120K in June?
$ME just broke out of a descending triangle on the 4H chart — bullish momentum building up!
Now retesting the breakout zone as support. If it holds, we could see a strong move toward $1.20+
Watching closely for confirmation.
#ME#Crypto#Altcoins#Breakout#TechnicalAnalysis
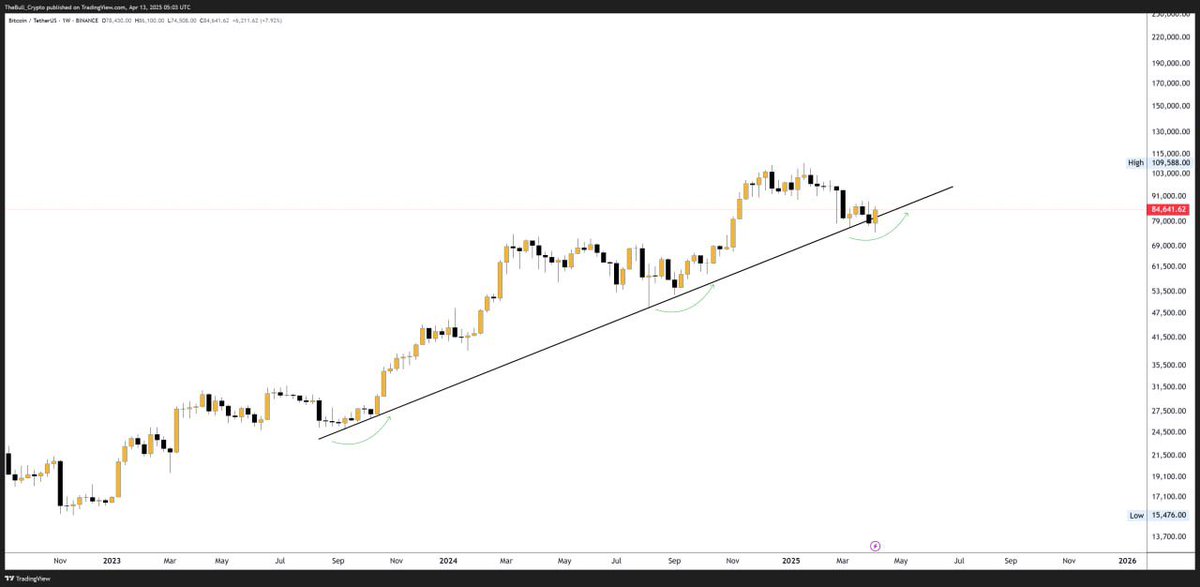
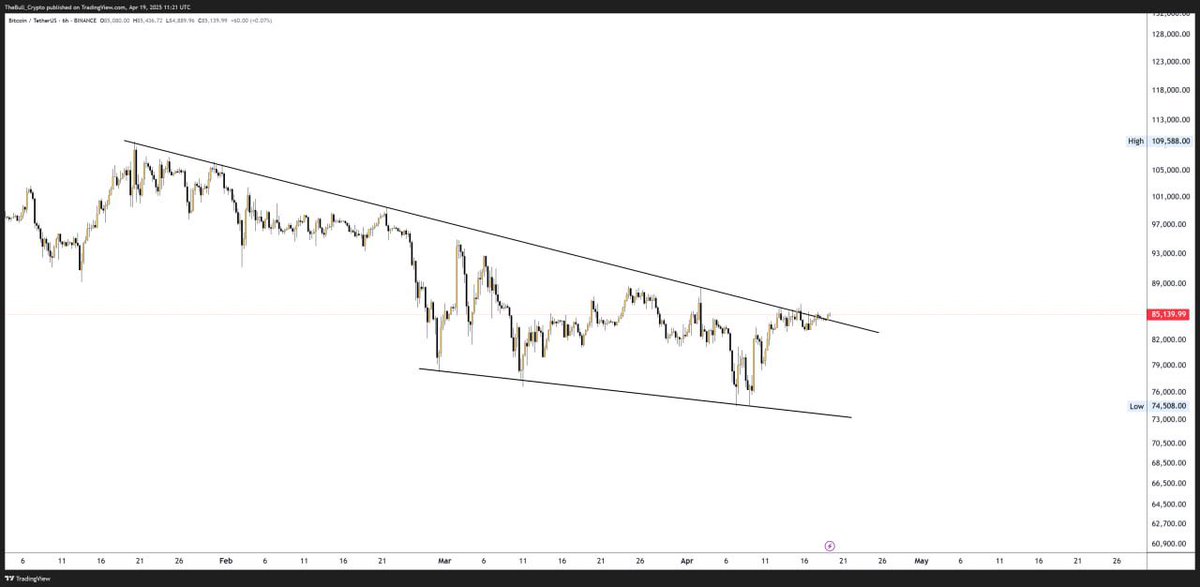
Bitcoin (BTC) on a 5-hour chart showing a descending triangle pattern with a current price of $85,135.90, down 0.47%. The price is testing the lower support trendline, with a high of $105,588.00 and a low of $74,508.00 over the period #Bitcoin#BTC#Crypto#Trading#ChartAnalysis
If BTC fails to break above 84,000 to confirm short-term bullish momentum in the next few days, a drop below 80,000 could occur imminently. Unfortunately, I'm a bit bearish right now as it’s looking weak
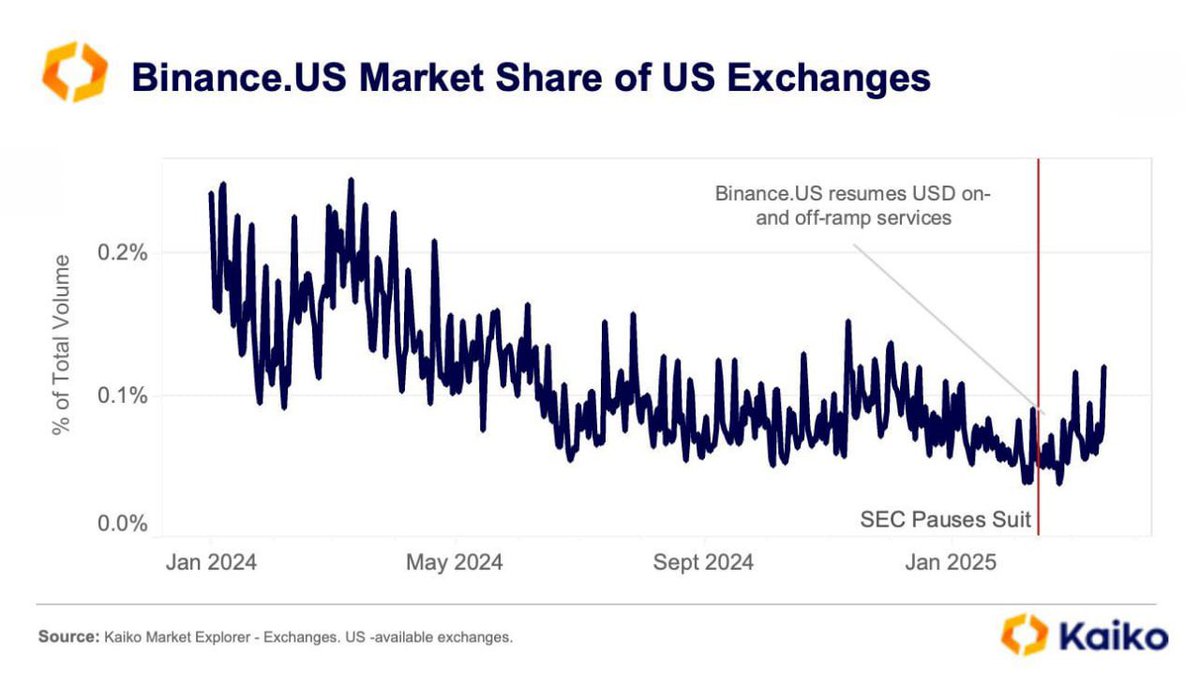
Since early February, Binance .US has seen its market share grow after the SEC paused its lawsuit against the exchange, ending months of decline that continued even during the crypto rally in November
• Singapore 10%
• Indonesia 32%
• Cambodia 49%
• Philippines 17%
• Switzerland 31%
• Bangladesh 37%
• South Korea 25%
• South Africa 30%
• United Kingdom 10%
• European Union 20%