In 2-4 weeks we begin Phase 2.
The primary risk is
$BTC experiences a sharp macro flush that breaches key structural support levels ($73,927 / $65,855), BTC.d and Stablecoin D will temporarily spike upward as capital seeks safety back in BTC and Stablecoins.
This push phase 2 out by an additional 4 to 6 weeks.
Phase 1: Bitcoin Stabilization and $ETH outperformance
Phase 2: Alt Season Acceleration
Phase 3: Parabolic Alt Season
Phase 2 and 3 could last a 3-4 months in duration. Remember BTC will also be rising during this phase.
Potential energy is locked and loaded on hedera-hashgraph:native
4H (slow P) - steady and positive.
1D (fast P): Low, coiled velocity hugging the baseline right under the 200 SMA. No distribution here. Imo it's quiet compression before the next expansion.
If you have been looking for an opportunity to add here is a great spot. Please be open to lower levels such as a backtest of the 20 EMA on the 1D chart.
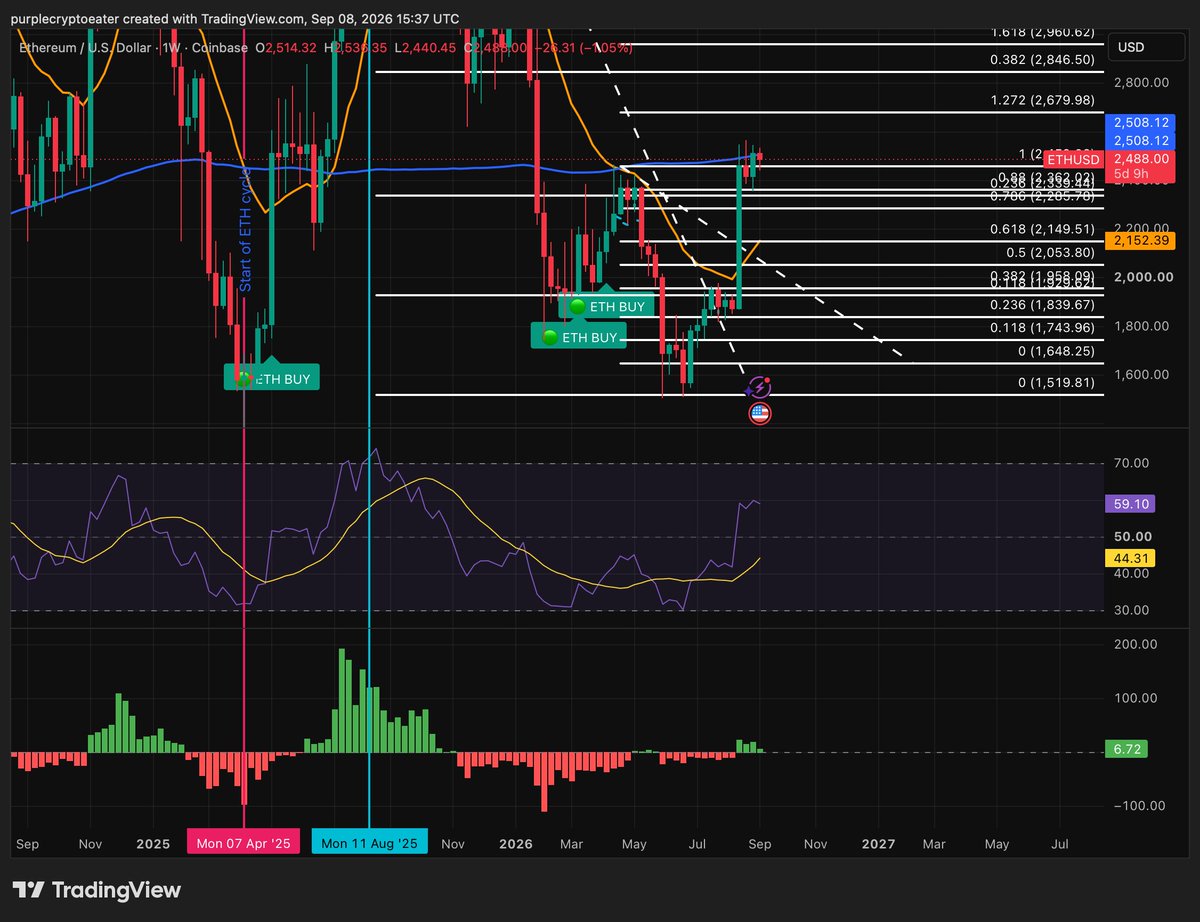
$ETH / bitcoin:native ready to go again?
We have gotten the first larger Impulse Index print and price is back above .88 fib.
Sellers could not regain control.
Continuation in order?
Time will tell
$CVX
The 3D Compression: Price is pinned right under that key 0.236 Fibonacci level ($2.266) and 200SMA
The 1D Compression/Springboard: On the daily time frame, the 20 EMA is acting like a springboard right keeping it wedged tightly against that same 0.236 line.
The Impulse Index (p) on the recent tight candles is essentially flat—no heavy red distribution bars, just orderly consolidation right on top of the daily moving average.
This opens the door to a strong move opportunity for CVX.
$ETH
3D and 1W compression right beneath macro resistance and the weekly 200 SMA, yet the sell volume is basically a flatline.
True distribution needs heavy red bars. This isn't that. It’s just potential energy waiting for an excuse to snap.
Literally no change for $USDT.D+USDC.D
1) Backtest of the .382 and 1 fib levels
2) Backtest of previous support from the capitulation of crypto.
3) P and acceleration is p = 0 (no momentum either way)
I am sitting on my hands from lower just have to let PA shake out weak hands and leverage.
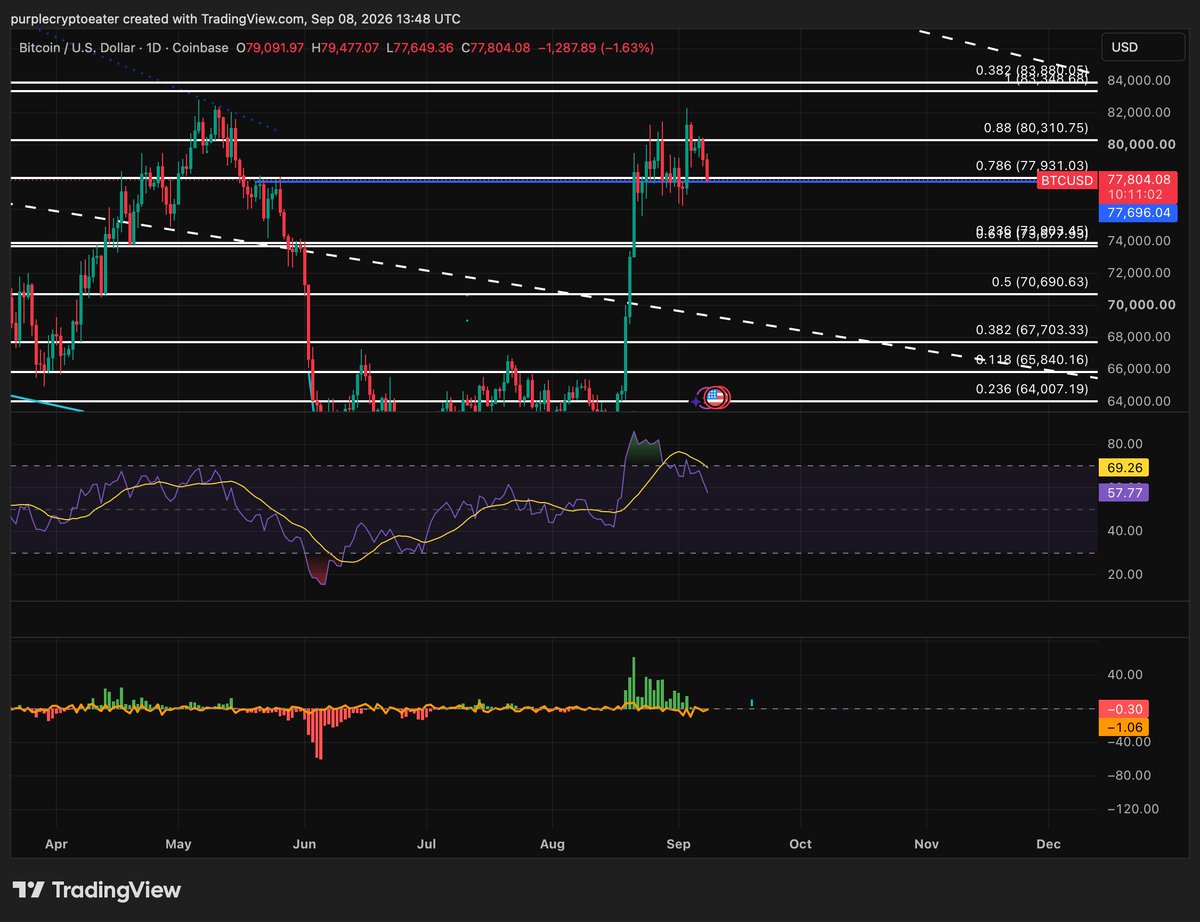
For bitcoin:native at current moment we have the following:
1) Price at capitulation levels backtesting
2) P and acceleration = 0 (no momentum in either direction)
3) Price testing yet again the .786 fib
If buyers don't step in then there could be small hiccups but for now it shows us we are just experiencing more chop.
Completely missing the mark.
This is exactly why I developed my new indicator on the bottom. It allows us to quantitative analysis of p. As you can see this move has current p > May 2026 p.
Demonstrating that the momentum is greater than in May.
Additonally, you can see selling momentum is significantly lower feb vs June.
bitcoin:native has been a lot of noise since Thursday.
Just right we touched the lower BB and is p<0 but just barely.
This tells us it's weak.
Until p breaks in either direction we don't know which way volatility brings us but we will know soon.
Based on HTF it should be up but we will get confirmation soon.
I've been looking for solutions to these exact problems and I have figured out an avenue to measure the energy of the market. I have named this indicator my Impact Index.
It's part of my larger Hypothesis System that is designed to focus on individual assets rather than the greater market. I believe the idea of specificity allows for more accurate outcomes. This however, does not mean generalized systems do not work. In fact they do work quite well. However, I personally prefer would rather develop systems with centralized ideas but specific engines that improve their outcomes.
Anyway I digress.
I'm now going to show you two things regarding .
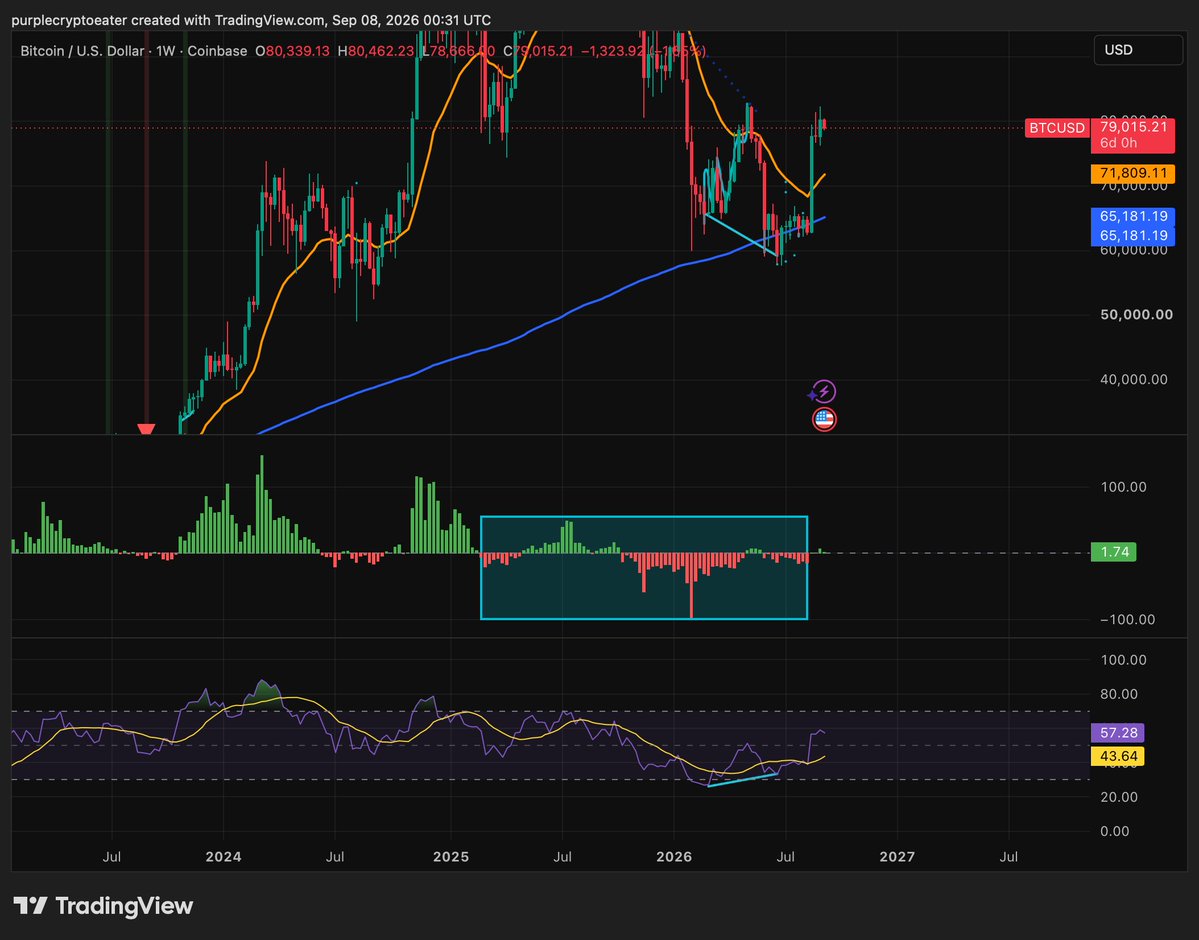
1. 1W Chart
The weekly timeframe establishes the broader structural baseline:
Weak Higher High (HH): Signaled momentum exhaustion prior to the macro downturn.
Bear Market & Capitulation: Cleared structural leverage and weak hands, resetting market conditions.
1W Bullish Divergence: Indicates institutional accumulation and a major cyclical shift.
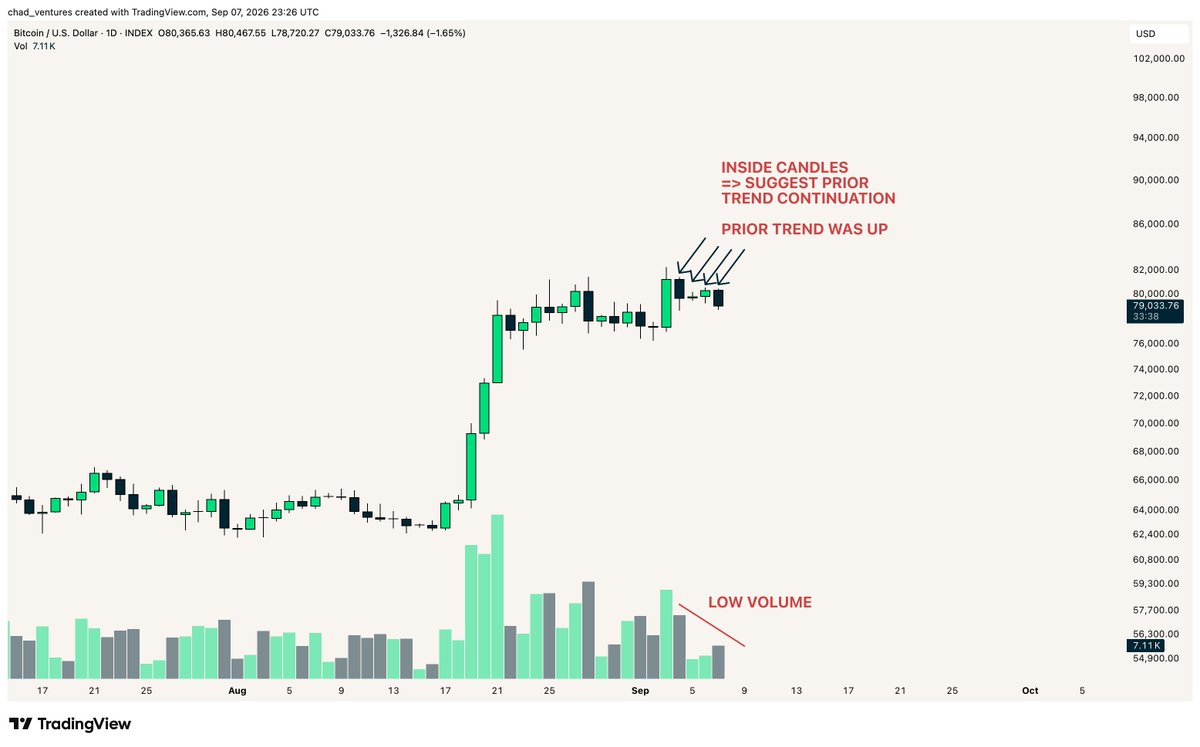
2. Reposted X post from @chad_ventures.
The Impact Index (p) measures underlying asset "energy" by isolating two core variables. This provides a clear, quantitative signal to filter out low-timeframe noise and evaluate the true momentum driving price action.
By measuring this we begin to understand that the past 4 (now 5 days) we have had values more or less a neutral p values.
Go to 4H and we will see since Thursday pump we have had p<0 but more or less neutral demonstrating low energy chop.
Zoom out to the 3D and we get a clearer picture of the middle term price action. While below absolute peak levels, p remains strong, confirming that medium-term bullish momentum is fully intact.
Key Takeaways
Macro Bottom Probability (99%): The combined high-timeframe structural alignment and Impact Index metrics strongly suggest the macro bottom is locked in, barring an unforeseen external force event (i.e. black swan event)
Short-Term Rangebound Action: Lower-timeframe price action remains low-energy chop—designed to shake out late leverage rather than reverse the trend.
Primary Trend Direction: Middle term and long term price action lends itself to be bullish and very bullish at times.
p= 4.41 sure it's lower than the highest measures but this tells us that bullish momentum is still with us.
When you begin to add this all up you can conclude the following:
1) The odds the bottom are in is 99% unless an external force of significant force arrives
2) Short-Term Choppy PA: Lower-timeframe price action remains low-energy chop—designed to shake out late leverage rather than reverse the trend.
3) Primary Trend Direction: Mid- and high-timeframe readings consistently confirm a prevailing bullish trend
Yes, bitcoin:native is stuck at the 50-week moving average right now.
However, I've found something interesting:
After that +5% pump on Thursday on high volume, price went on to form 4 consecutive inside candles on low volume.
Inside candles suggest prior trend continuation
Prior trend was up
So, you tell me. I'm just objectively pointing out facts.
Thanks. This indicator came from playing backyard bocce ball with my daughter. Being the nerd I am I explained the physics to her and thought OMG this is a script to answer the question I had been trying to answer.
Yes, I wish humans didn't have to sleep but we do.
I've only developed specific lol The Impact Index is the first generalized script that I can pull up any stock and it works out out box. The others are specific to the individual because each crypto has its own personality imo.