“The stakes are high. Time is short.”
Very excited for this series, Repowering the West, by @Sammy_Roth. The first story is out today! https://t.co/ZP0NjMZxPA
.@latimes now has a comprehensive drought tracker, courtesy of @seangreene89 & @thomas06037. Keep tabs on how much water your community is saving (or not), the status of various reservoirs and how bad conditions have gotten across the West: https://t.co/g8IItwgTGd
Map of CDC's new COVID community level framework. Universal masking is recommended when the level is "high."
L.A. County is officially still in at "high" level, but will likely officially get to "medium" next week https://t.co/H2bviwCUgb @LukeMMoney@thomas06037
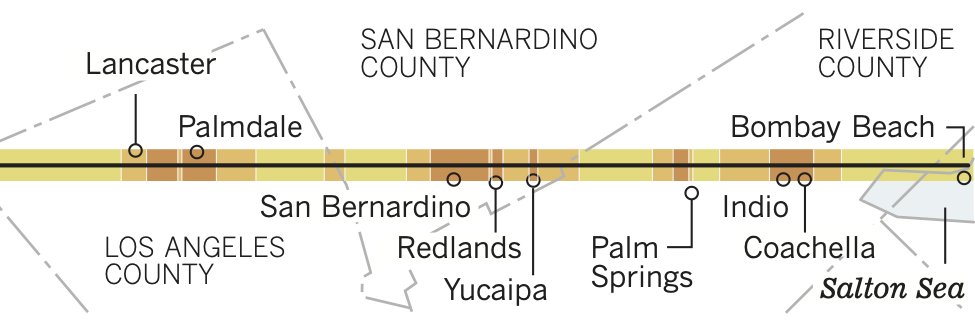
@seangreene89@palewire i wish! some groundbreaking work here from @seangreene89, allowing us to link custom vector maps with our cms’ responsive iframes. it's a big deal for us, esp. since these maps illustrate key components of the story
@ashhwu@palewire@datagraphics Thanks much Ashley, developer of the interactive cheap pizza app (with @gaufre and @priyakkumar), which is sadly broken ... but the story lives on! https://t.co/6k9dIKSbBP
@MikeStucka@palewire@shmcminn@BrizAndrew@Datawrapper our docs are somewhat in flux but potential there for release, good thought, especially for less CMS-specific parts. also, good documentation on DW's own site
have started using API for updating/publishing graphics, not so much creation from scratch. yet. the API does a lot
@palewire@LoElebee@CartoonKahuna@latimes @ryanvmenezes @VanessaMartinez Everything really kicked into high gear with the creation of this task force. also including @rdmurphy who did a stint before moving on to @MarshallProj, but even before that brought in valuable tech expertise and design/journalistic insights
@eulken@palewire@datagraphics thanks, Eric! first published interactive i worked on (distances teams have to travel for 2008 NCAA tournament) was during Eric's tenure here
@W_R_Chase@palewire@JonRMcClure@cjsinner@Datawrapper @jared_whalen Interesting … DW's built-in function that auto-updates from public csv files works great for charts, we've used those a bit. But with symbol maps, we just recently started using API to upload data then publish via cURL / python wrapper. There's a lot in that API