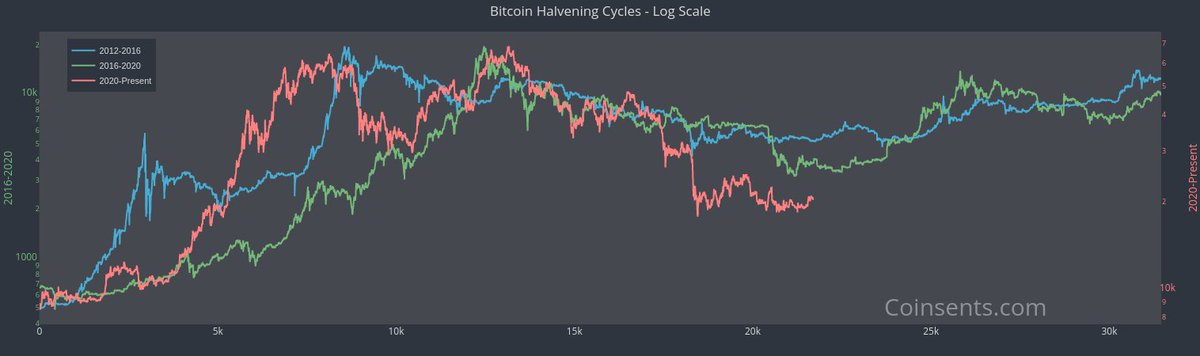
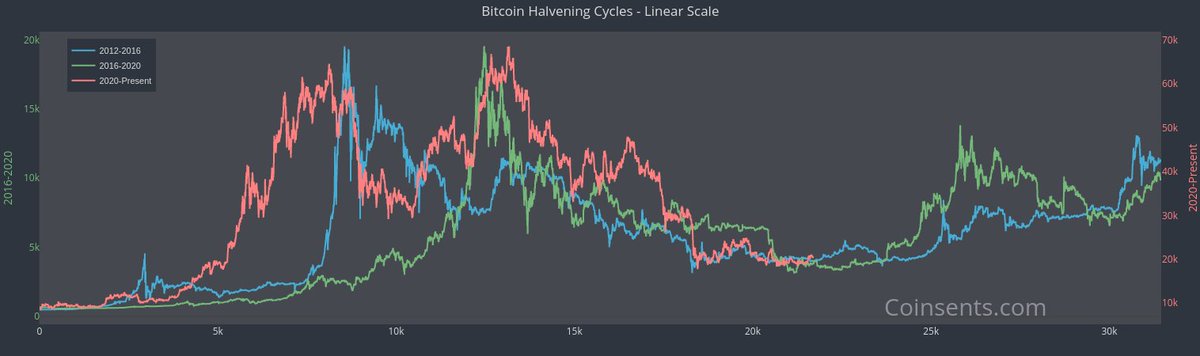
For those expecting a final Nuke in November - the same chart in Log Scale shows a much lower dip this time around. Dipped earlier and further down. According to the previous cycles, the dip from $30k down to $18k should have been the final capitulation range.
All three charts begin on the day of the Halvening and run up and until the day before the next Halvening.
This last cycle front ran the 25BTC cycle, and then fell in line with the 12.5BTC cycle.
If we're not at bottom, we're close. They all bottom around the same area.
Visualize the #Bitcoin 4yr Cycle
I took the historic hourly prices for Bitcoin and separated it into overlaying charts representing the different emissions cycles running as follows:
25 BTC 11/28/12 to 7/8/16
12.5 BTC 7/9/16 to 5/10/20
6.25 BTC 5/11/20 to present
@JennWSFA @aldemocrats@wsfa12news You should be publishing news like this frequently. If our officials recruited enterprise the way our coaches recruit athletes, you would be.
@aldemocrats There's no more fundamental pillar to our society than free and fair elections. Definitely time to be thinking about how we conduct an election without public gatherings-- primaries, debates, rallies, townhall meetings, conventions -- backup plan needs to be drafted.
@VitalikButerin@Antoni13874658@canesin@achlem@nashsocial Don't know how to address your technical questions, but here is an article published today out of the Nash Ambassador program discussing current updates. https://t.co/Oox5RycdIp
$NEX #Nash
@ThatsCorrect@nashsocial If you have automated trading bots, you can now test them in a practice environment that simulates the exchange. The API is how trading bots communicate with the exchange; and that is now open and available for people who want to acclimate their bots for live trading.