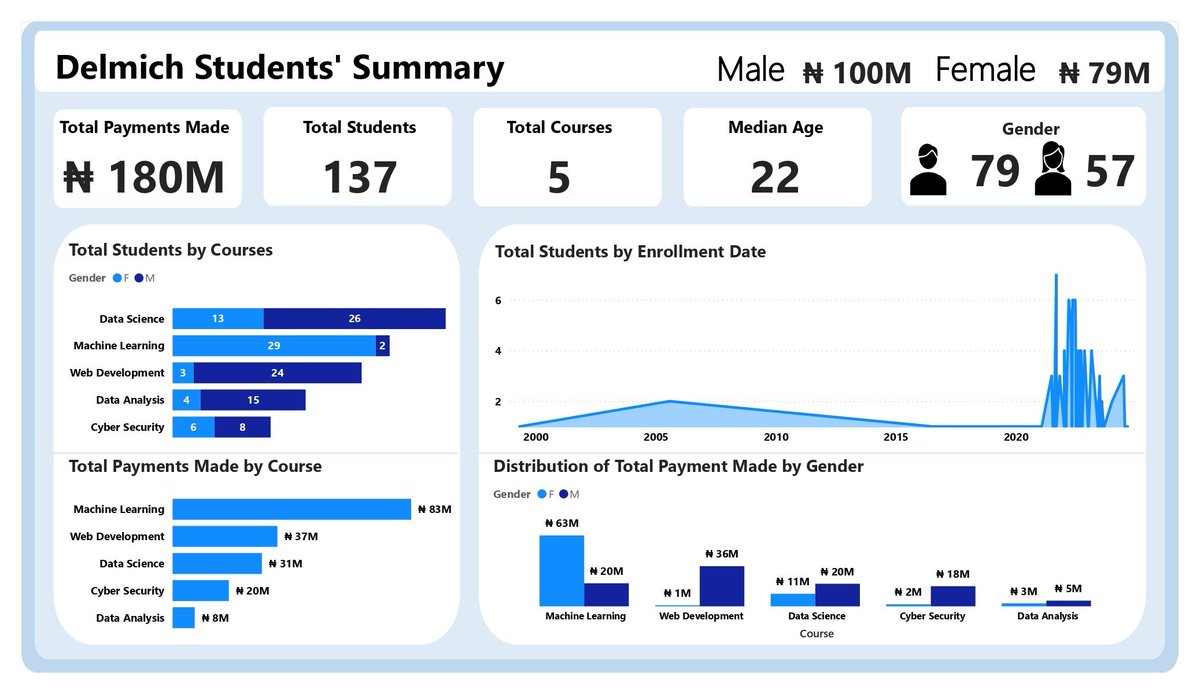
I have completed an analysis of a brewery dataset containing sales information from 2017 to 2019.
My descriptive analysis covered sales and profitability, brand performance, and geographic distribution. I'm open to corrections.
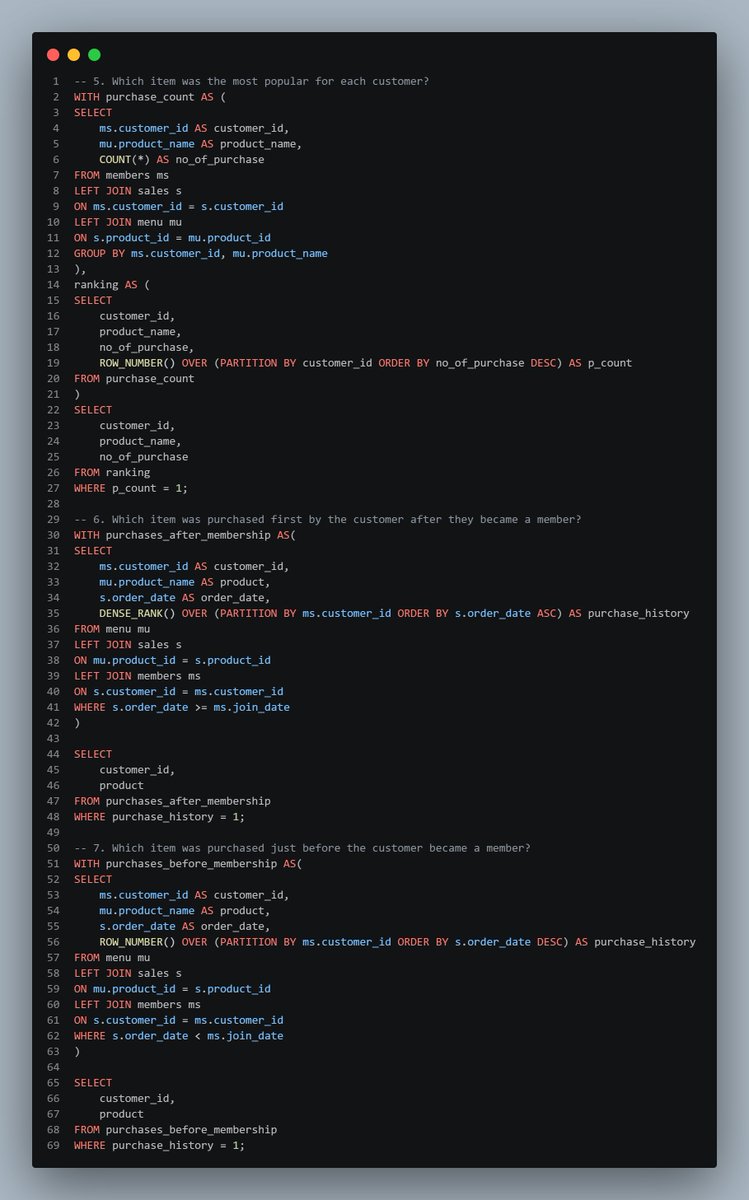
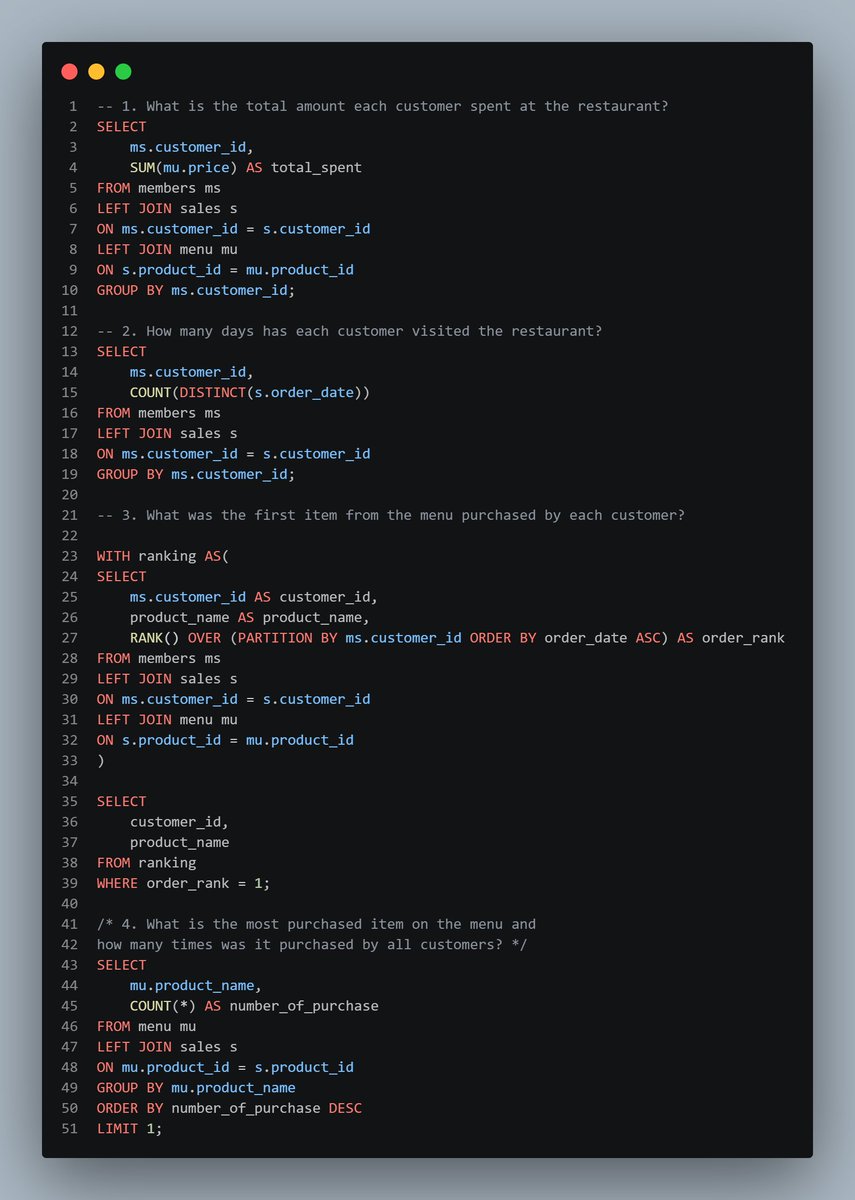
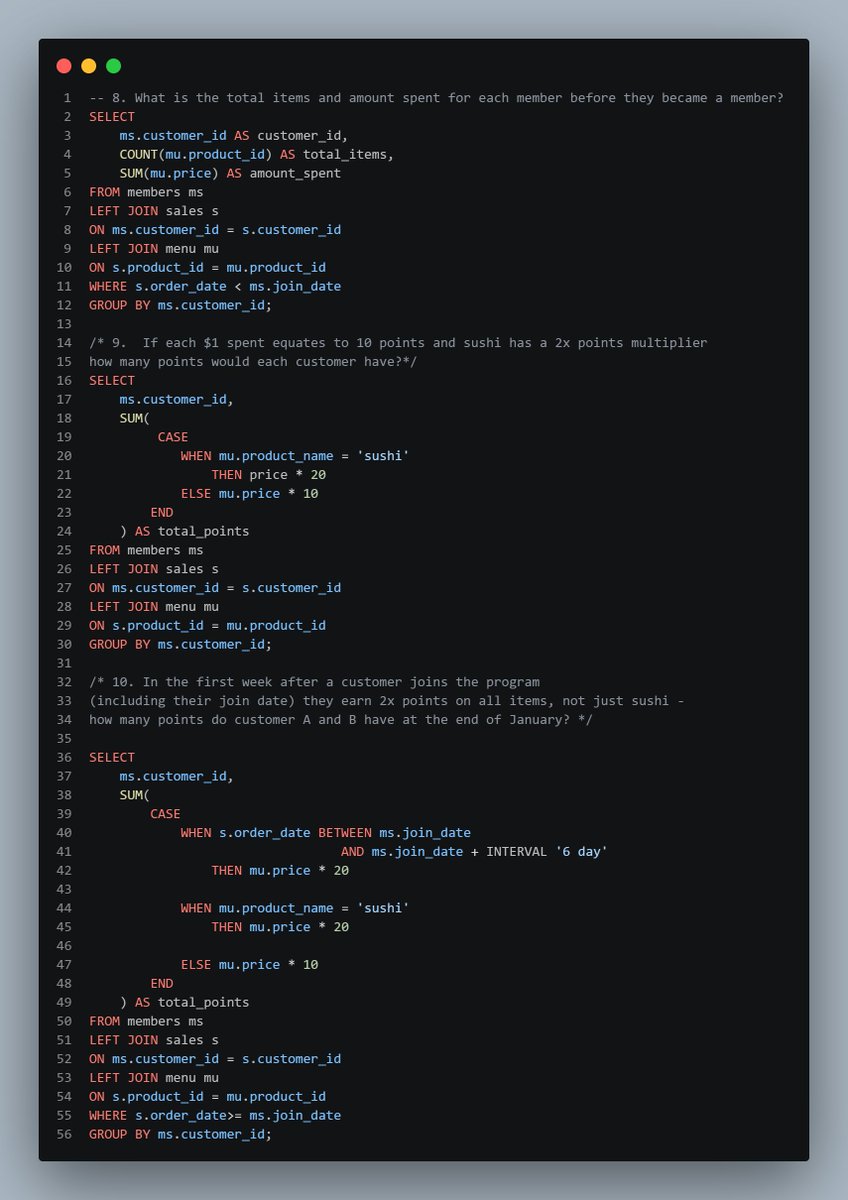
Completed Case Study #1: Danny's Diner from the 8 Week SQL Challenge by 𝐃𝐚𝐭𝐚 𝐖𝐢𝐭𝐡 𝐃𝐚𝐧𝐧𝐲
Solved business questions with PostgreSQL using joins, CTEs, aggregations, CASE statements, and window functions.
#SQL#PostgreSQL#DataAnalytics#8WeekSQLChallenge
🏅 Did you know that until 1992, the Summer and Winter Olympics were held in the same year?
I discovered this while analyzing 271K+ Olympic records (1896–2022) for a Power BI project completed as part of an interview assessment. 📊
Documentation: https://t.co/y5RkDO0M0V
There’s a recruiter on LinkedIn I’ve been following and admiring for a while who shared that she applied to the same company about 10 times before finally getting hired.
When she got the role, you could genuinely see how excited she was. She posted about the company often and seemed incredibly grateful to be there.
A few days ago, she announced her resignation. Since then, she's been sharing some of the reasons behind her decision to leave.
What’s even more mind-boggling is that she admitted she left without having any backup plan and she’s back in the job market willingly.
She just reminded me that sometimes the role you've dreamed about for years can turn out to be very different from what you imagined.
🏅 Did you know that until 1992, the Summer and Winter Olympics were held in the same year?
I discovered this while analyzing 271K+ Olympic records (1896–2022) for a Power BI project completed as part of an interview assessment. 📊
Documentation: https://t.co/y5RkDO0M0V
My problem with the insecurity crisis is that children now have to learn a new word: "bandit."
In a sane country, that shouldn't be part of a child's vocabulary.
REMOTE DATA ROLES FOR NIGERIAN PROFESSIONALS - May 2026
Global companies paying USD. No visa required. Real numbers.
WHAT THE MARKET PAYS (remote, USD, Nigeria-based):
>> Junior Data Analyst: $25,000 – $40,000/year
>> Mid-Level Data Analyst: $40,000 – $65,000/year
>> Senior Data Analyst / Engineer: $65,000 – $95,000/year
At current exchange rates, the mid-level range is roughly ₦65M–₦105M annually.
WHERE TO FIND THESE ROLES:
>> Andela - https://t.co/phOfr4pmvm
Matches vetted African engineers with global companies. Technical test, English communication test, portfolio review. Worth doing even if you think you might not pass. The feedback is useful.
Turing - https://t.co/lPTjxBXApO
Remote roles with US companies. SQL, Python, BI tools tested directly. Apply, pass the screening, get matched to a company.
We Work Remotely - https://t.co/12GaTULPu6
New roles daily. Filter: Analytics. Many open to global applicants.
Toptal - https://t.co/eUaIfybgvr
Senior level only. Top 3% screening. If you pass, premium USD rates.
WHAT THESE COMPANIES ACTUALLY SCREEN FOR:
1. Technical: SQL and Python tested, not just listed on your CV.
2. Communication: Video or live interview in English. This is often what screens people out.
3. Portfolio: One strong project with documented business impact.
Nigerian domain experience is transferable.
Fintech, FMCG, telecoms, consulting, frame it in global business language.
The opportunity is real.
The barrier is preparation. Not location. Not passport.
I have completed an analysis of a brewery dataset containing sales information from 2017 to 2019.
My descriptive analysis covered sales and profitability, brand performance, and geographic distribution. I'm open to corrections.
Nobody gives you this when you start a new data role.
Here is exactly what to do in the first 90 days, and in what order.
>> DAYS 1–30: LISTEN MORE THAN YOU BUILD
Do not build anything yet.
Ask every stakeholder you meet one question: "What is the one data problem that costs you the most time or money right now?"
Write every answer down.
By day 30 you will have a map of what actually matters, completely different from what the job description said.
Find out:
- What is the most important metric in the business and how is it calculated?
- Where does the data live and who owns each source?
- What reports get used and what reports get ignored?
>> DAYS 31–60: BUILD ONE SMALL THING THAT WORKS
Pick the highest-frequency pain point from your first 30 days.
Build one thing that fixes it. A clean query. An automated report. A single focused dashboard.
Make it visible. Share it. Get feedback.
This is not about impressing anyone.
It is about establishing that you deliver, before you start asking for access, resources, or buy-in on bigger projects.
>> DAYS 61–90: DEFINE WHAT YOU OWN
By day 90 you should be able to say clearly:
- These are the metrics I am responsible for.
- This is the cadence I deliver on.
- This is the one strategic project I am building toward.
If you cannot say that, you are still waiting to be told what to do.
Senior data professionals do not wait.
They arrive, observe, and decide what the most important work is.
Then they do it.
Seven years across multiple organisations. One pattern I can now spot in an interview.
There are four questions that tell you everything about whether a data role will actually use your skills, before you accept the offer.
1. "What was the last analysis that changed a business decision here?"
If they cannot name one, data is decorative.
2. "Who does the data team report into?"
IT reporting line: data is a support function. Finance or commercial reporting line: data is in the decision loop.
3. "How long does it typically take to go from analysis to action?"
- Months: bureaucratic.
- Weeks: structured.
- Days: empowered.
4. "What does the data team wish the business understood better?"
The answer reveals what friction exists between data and decisions, and whether that friction is being addressed or accepted.
You are not just evaluating whether you can do the job.
You are evaluating whether the environment will let you do it well.
Skilled analysts in poor environments plateau.
Average analysts in excellent environments outperform.
The environment is not a secondary consideration.
It is half the role.
The busiest analyst on the team is rarely the most valuable one.
Busy looks like this:
- Answering every ad-hoc request within the hour
- Maintaining fifteen dashboards that refresh weekly
- Attending every meeting where data might come up
- Being the person everyone goes to for a quick number
Valuable looks like this:
- Proactively identifying a trend before anyone asked
- Reducing a process that took six hours to thirty minutes
- Telling a stakeholder their question is the wrong question
- Producing one piece of analysis that changed a decision worth £X
The busy analyst is reactive. The calendar owns them.
The valuable analyst is selective. They own the agenda.
Most organisations reward busy because it is visible.
But the analysts who grow fastest are the ones who learn to say no to low-leverage requests and spend that recovered time on high-leverage work.
You cannot do this without first knowing which of your work is actually making an impact.
Track it. For two weeks. Write down every task and whether it influenced a decision.
What you find will surprise you.
I currently run 3 businesses:
1. Alex The Analyst on YouTube
I say "business", but this one is my lowest revenue and time investments, but I do make some money from it. I do it because I love it and have always loved it - this takes maybe 5-10 hours per week.
2. Analyst Builder
This is my ed-tech platform to teach people Analytics and help them land jobs faster. This takes more time and I have a whole team that supports this platform. This takes 20-30 hours per week.
3. Alex Analytics LLC
This is my consulting business where I work with tech companies and startups. I do everything from helping with pricing strategy, data migrations, data analysis, to creating content. This takes 30-40 hours per week.
I didn't start out with all 3, they evolved over time. I started with my YouTube channel, and as that grew, I slowly started consulting. I started a small mentorship program and as that grew I created Analyst Builder to serve more people.
Things don't happen overnight and they don't always look like what you think they will. I'm a big believer in starting small and growing it until it makes sense to pivot.
@NyameNhyirahwo@vheeorji22 SQL will definitely work. Power BI works too. Most times, when we emphasize specs, it’s all about speed. The faster, the better.
@inkandideas_ Just take it as for anytime you use aggregation functions, e.g COUNT, SUM, MAX, MIN, AVG, you must group the non-aggregated column(s) in your SELECT statement.
Hi #datafam! I Built an end-to-end Procurement Data Warehouse in SQL Server for the FP20 Analytics Challenge. Designed a star schema with 5 dimensions + FactProcurement to analyze spend, savings, lead times, supplier risk, ESG & maverick spend. #SQL#DataWarehouse#FP20Analytics
If you didn’t know before, know this now: inline queries are simply subqueries written inside the FROM clause.
Might save you in an interview someday. I was asked this today and completely blanked out.