Why Certain @Qullamaggie Trading Rules Stand The Test Of Time As Golden.
After a broad market pullback, most questions tend to focus on, 'What rules do you use to manage unrealized profits and avoid significant profit losses? Taking on too many new positions has always been my pitfall—how can I overcome this over time?'"
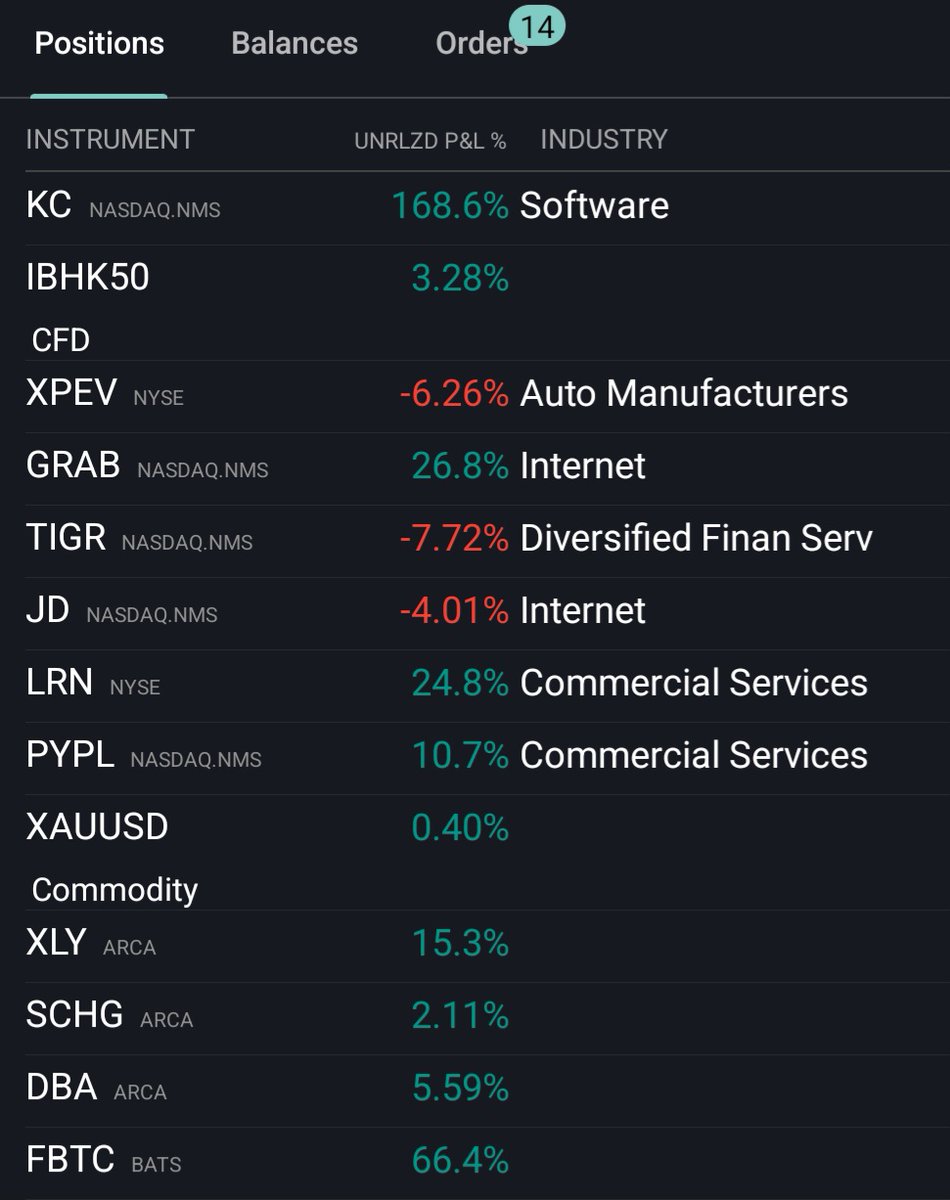
I am currently carrying 13 positions, with a spare 30%-40% cash level. Aside from $FBTC, I built the portfolio with barely 6-7 position since the beginning of November at 130% level with margin. There are certain golden trading rules here that clearly demonstrate why they are considered golden in the first place,
@Qullamaggie has emphasized the same principles repeatedly throughout his 7 years of streaming. So imagine him 'screaming' the following to you again;
1. "Always Sell Some Into Strength!"
- because you locked in realized profit to reduce unrealized profit volatility, and you get to free up funds for newer opportunities in subsequent setup as the market continue to shape. $GRAB $FBTC $KC $XLY $DBA $LRN $PYPL $SCHG. The 8 positions highlighted undergone a 25-33% sale in T+3 day, subsequent 10 x ATR% extension from 50-MA (nett 25-33% sale), gap up sale eg. $PYPL yesterday (nett 25-33% sale).
2. "The second you think you are smarter than the 10 & 20 day MA, that's when you are doomed for mediocrity. Trust me. I talk from experience."
- While you implement a partial profit/sell rule, you do not sell everything until the market proves you wrong. Who would have thought $KC trade could make a 200% gain in a month? Learn to hold your position and ride winners. The outlier position that can make a impact in your % performance are often those that you do do not expect to make a huge move. $FBTC $LRN are the only position that closed below 10-MA from yesterday's move, so those are the only position that may take me out on M15 opening range low.
I wrote a piece here on systemizing profit taking a few months ago
https://t.co/v6ADk5Wtos
3. "If it hit your stop, you grab your balls and hit the sell button''
- It’s a bit embarrassing to admit, but I’ve been highlighting China names on my posts for weeks—and the move finally happened yesterday. Aside from IBHK50 futures that wastaken last week when it break its range, I took $XPEV $JD $TIGR from yesterday's breakout at open. Picture perfect setup; RVOL 60% in 5mins, LoD was less than 60% for the 3. Before the market close, I was already hit with 2/3 stop for 2 of the position and 1/3 stop for 1 of the position. The 3 are poised to open with a much reduced gap down later (the post market % loss was much more 6 hours ago), I will take the loss. This is also where the magic of 3 level stop at 33% level plays out. It protects your downside and I am very unlikely to hit with 3R loss for the 3 trade. I also wish to qualify that there are 9 further losing trades in the last 9 weeks. $VRT $SCO $TECL $AMPX $JDST $SYTA $ERX $UNG $GGLL
This is how 3 level stops work if you want to read more.
https://t.co/66l2UNEavn
Another rule that I strongly urge everyone to explore and implement is reducing and set a limit to your daily-weekly new position frequency. Go to your journal and track that 1-3 days duration (MoM) that you are 'hyper' actively executing new position, Are the outcome desirable? If not, taking on too many new positions will always be a trading pitfall, and you can fixed this immediately. I strongly believe in the edge of knowing when to go 'heavy' vs 'light' in terms of trade frequency and activity. I will be reluctant to new risk exposure when $SPY is 4 x ATR% from 50-MA when it historically pullback from 5 x ATR% from 50-MA
While I was preparing this writeup, I also just came across @stamatoudism post on application of ADR% of on portfolio management. This is something worth exploring if you have unrealized profit volatility issue in your portfolio management. I sincerely believe topic like this will grow you much more as a trader than just flipping charts daily without having a tolerance and risk control of unrealized profit loss in real time situation.
Here's quote from yesterday's post market TTG Stock Market Recap by @cfromhertz that may help you to look at this situation in a different light,
"If you've been doing this for awhile, you actually like a little bit of these pullbacks. They help reset the market, especially when buying during a period of overheated momentum and growth wouldn't have been wise."'
- @cfromhertz , 9/12/2024 Stock Market Recap by TTG: China Gaps Up / Growth Takes A Well Earned Breather - https://t.co/Jgo3NPqJdC
My Favorite Weekly Chart Setup: The "Character Change"
This is my go-to setup for getting into new uptrends early, and it’s something I use only on weekly charts.
The CC (character change) is all about patience and waiting for clear evidence that the trend has shifted.
⚠️ If you’re looking for quick trades or need to be active, this might not be for you, because these require you to sit after you get in for a long time and let it do it's thing.
Why Weekly Charts?
Weekly charts smooth out a lot of the noise you see on daily charts. They give you a bigger picture and help you see the trend more clearly.
What Is the "Character Change" Setup?
This setup is about recognizing when a stock is transitioning from a long downtrend to the early stages of an uptrend. It’s all about waiting for specific signals on the weekly chart that show that it is highly likely the long-term trend is now up.
Here’s what I look for:
1. First Higher Low
After a long downtrend, I look for the stock to make a higher low on the weekly chart. This alone isn't enough but it's our first piece of evidence that something might be up.
2. HUGE Volume with a Price Pop
The other thing to look for is a big surge in volume with a strong price move. This shows real institutional interest. This is our second piece of evidence. You have a higher low + it's first massive push. After this I have confidence the birth of a solid new trend is likely in place.
Also the 1st or 2nd above can happen in any order you just want to see both.
3. New 10 Week respect
The way you get a low-stress entry with incredible R/R is by waiting now that you have the evidence of a true CC on your side. The 3rd piece of the puzzle where you can enter with extremely low risk if it doesn't work is when you see the stock start to respect the 10-week moving average for the first time.
Example 1: $APP
Let’s look at APP, which had a huge run after showing this setup and my second best trade of all time.
1. Volume Pop: First, I noticed a big volume spike, but I didn’t jump in just because of that alone, not enough evidence.
2. First Higher Low: After the volume pop, the stock pulled back a bit and made a higher low. That’s when I got interested. As it made that higher low, it started respecting the 10-week moving average.
3. Holding the 10-Week: It then resumes its move being supported clearly by the 10 week again. That’s the final confirmation needed.
APP took time to develop this setup. Even though it might look like dumpster diving, since these are weekly charts, the downtrend is long over before it becomes a buy. From there, it just kept riding the 10-week line up , giving you multiple chances to add to your position if you caught it or many chances to get in.
Example 2: $PYPL (currently developing)
PayPal was dead money for a long time, making lower lows. Then early this year we started developing a CC.
1. Higher Low: This grinded sideways but still ended up being a big higher low.
2. Volume Pop: Here we get a big price push on volume. Technically we had a few before the higher low was confirmed, and an entry could have been established after the higher low because the risk is so low. But this was the clear Volume pop.
3. New 10W Respect: This is final evidence for me, off the volume pop the weakness is supported by the 10W for the first time. Super low risk entry and you can see if this is a real long-term trend then we are still very early.
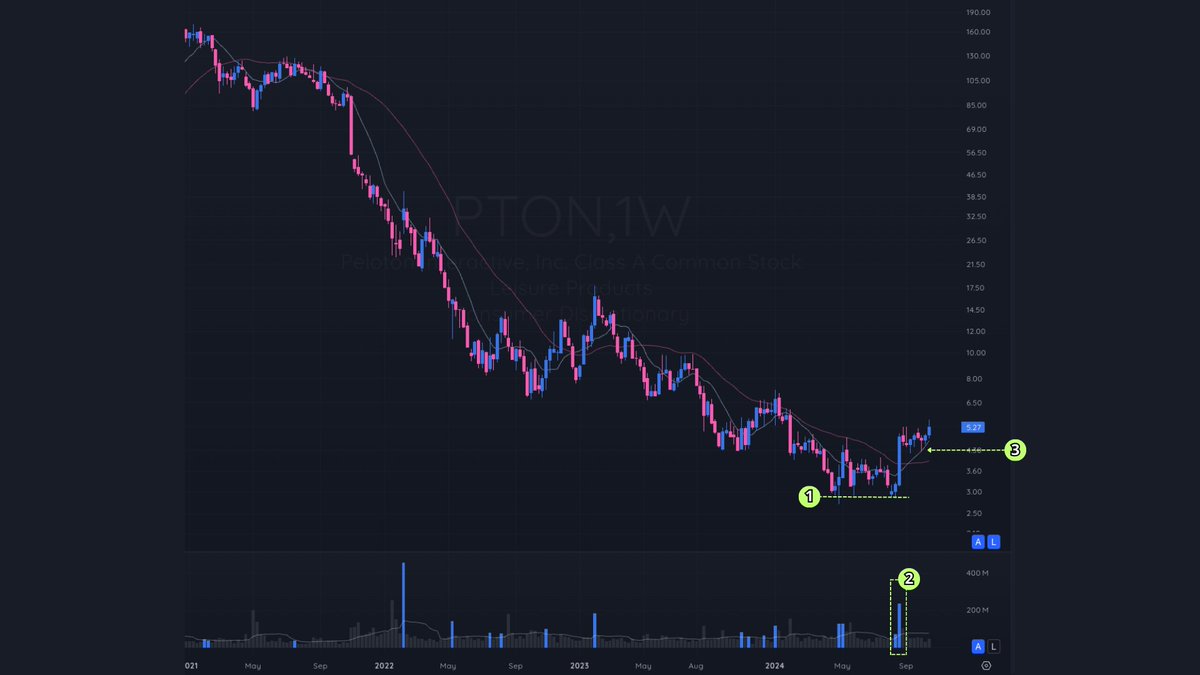
Example 3: $PTON (very early, still developing, and new position)
Peloton had been stuck in a downtrend for over two years, so I didn’t even consider buying until it started showing evidence that the downtrend might be done.
1. Higher Low: Instead of breaking to a new low, it held up at a slightly higher level. It’s subtle, but this is a big clue that the character of the stock is shifting. (It was kind of a retest of the same low, not much of a higher low, so you can argue #3 on the chart is also the first higher low. Doesn't matter, by 3 you have all 3 pieces of evidence.)
2. Volume Pop: Next, a significant volume spike paired with a strong price move. But I don’t buy just because of a volume spike—I need more confirmation.
3. Trading Tight into the 10-Week Moving Average: After the volume pop, PTON started trading tightly near the top of that move and right into the 10-week moving average. This is what really got me interested because even if it fails, I can't emphasize enough.... the R/R for these types of setups is off the charts.
The big thing here is patience. I don’t jump in while a stock is still in a downtrend. I wait until it’s made a higher low, shown a volume surge, and started respecting the 10-week moving average. By the time I get in, the downtrend has usually been over for a while. I’m letting the stock prove itself first.
Quick Recap
Here’s what makes the character change setup work:
1. Higher Low on the Weekly: Signals the stock might be done making new lows and could be shifting to an uptrend.
2. Volume Pop: A big volume spike with a price move. This tells you that there is now real interest in this name and adds evidence to support the birth of a new trend.
3. New 10-Week Respect: This helps add further evidence the momentum is on your side and allows you to get in with really low risk if it doesn't end up working.
Remember, this setup takes time to develop. The hardest part is the patience. It is a lot of hands off and waiting but thats also how I like my trades. Low stress.
Less is more!
If you made it here...drop a reply—I’d love to hear your thoughts and questions.
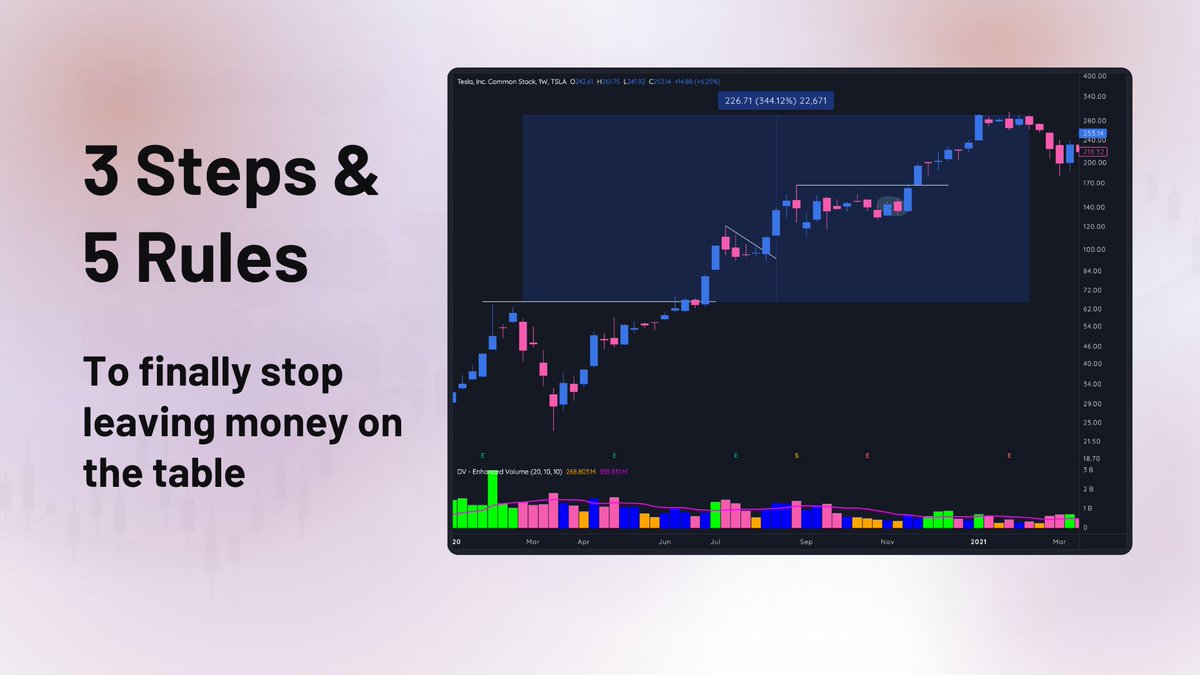
Struggling with when to take profits?
It's the one skill that separates retail traders from the market wizards (who make millions).
We’ve simplified selling into strength into 3 actionable steps (plus 5+ rules you can use in tomorrow’s session).
Let's dive in ↓
‼️ Study the biggest winners this weekend 🚨
Model Books from the past 6 years from @traderlion 👏
2018
https://t.co/4zXjIWOEZi
2019
https://t.co/p7PfQE3Suf
2020
https://t.co/LGhlr0eK8s
2021
https://t.co/CeW5qYnArv
2022
https://t.co/orzwUImukz
2023
https://t.co/Br1kt6lX7D
10 Stock Market Books to Read or Reread in 2024!
1. How to Make Money in Stocks by William J. O’Neil (1988)
2. Reminiscences of a Stock Operator by Edwin Lefevre (1923)
3. The Nature of Risk by Justin Mamis (1991)
4. Trader Vic: Methods of a Wall Street Master by Victor Sperandeo (1991)
5. Trade Your Way to Financial Freedom by Van K. Tharp (1999)
6. The Battle for Investment Survival by Gerald M. Loeb (1935)
7. Martin Zweig’s Winning on Wall Street by Martin Zweig (1986)
8. How to Trade in Stocks by Jesse Livermore (1940)
9. Market Wizards: Interviews with Top Traders by Jack D. Schwager (1988)
10. When to Sell: Inside Strategies for Stock-Market Profits by Justin Mamis (1994)