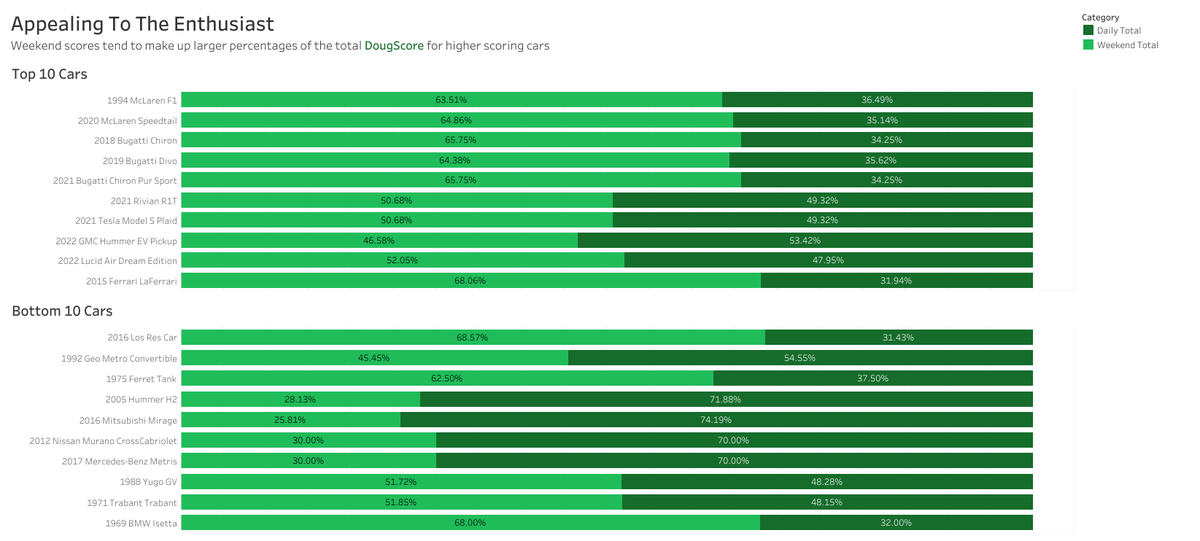
#MakeoverMonday on a Wednesday. Looking at the #DougScore and how weekend scores tend to be a larger portion for higher scoring cars. #Tableau#DataViz
https://t.co/pT9jUwmawT
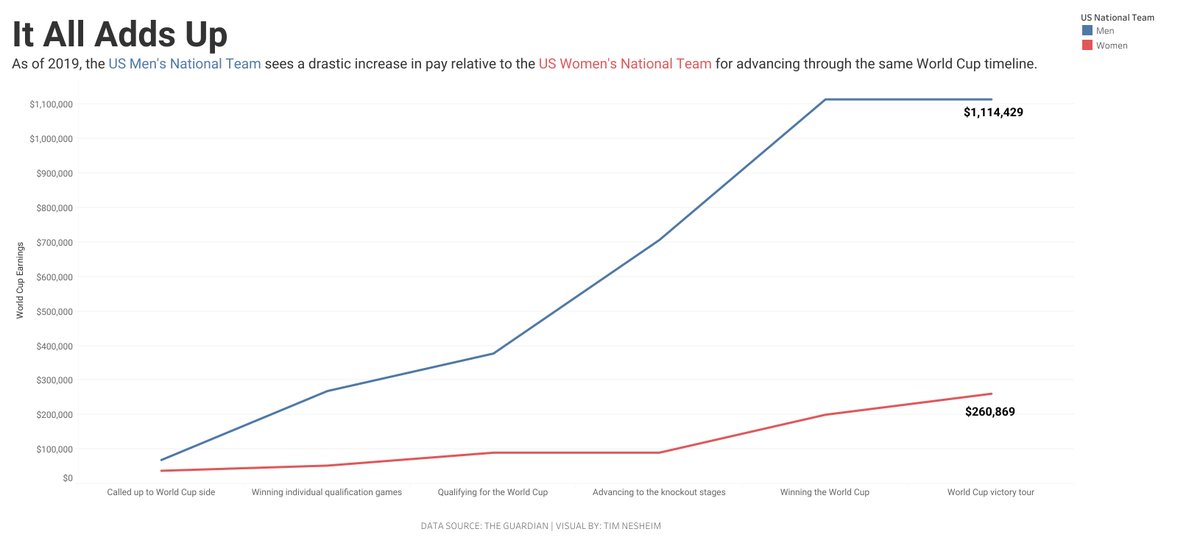
My first try at #makeovermonday looking at the pay gap between the USWNT and USMNT for the World Cup. #Tableau
Link to Visual:
https://t.co/mtljOHdLrz
Link to Data: https://t.co/kbDfdnA5ac
A look at retail sales in my home state, specifically in sectors that could be more related to big purchases for consumers. #TidyTuesday#RStats#dataviz
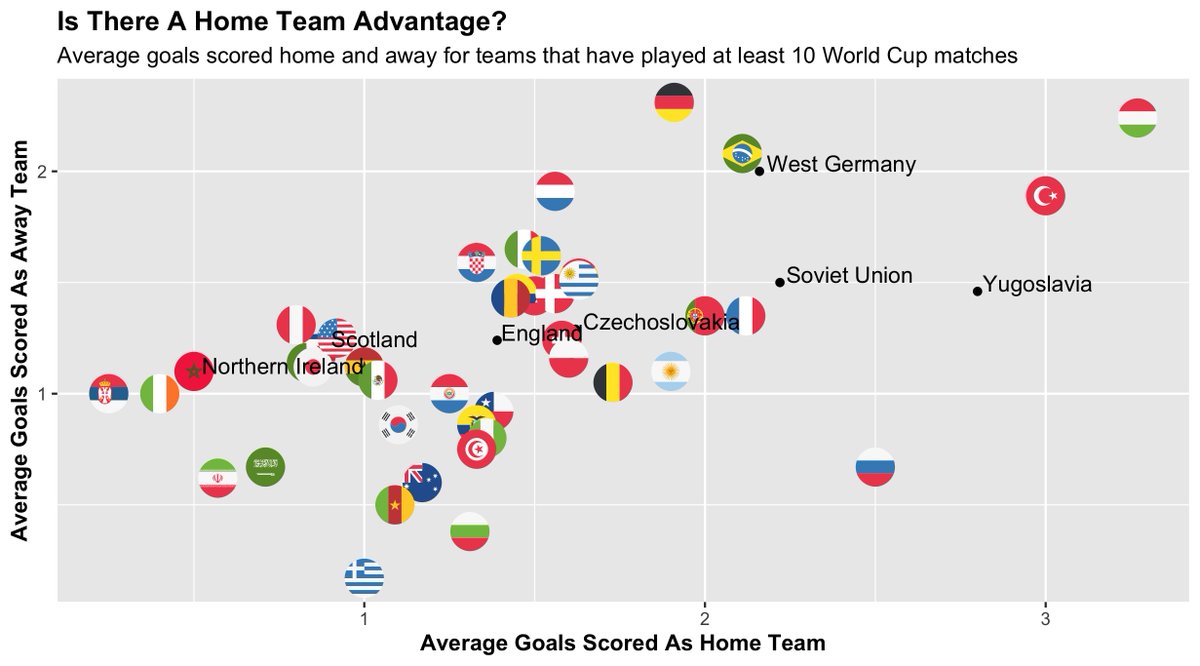
Using #ggflags for #TidyTuesday looking at average goals per match scored as the home team or away team. A little messy but not a bad first attempt. #RStats#dataviz
Code: https://t.co/1r3T7eJXLZ
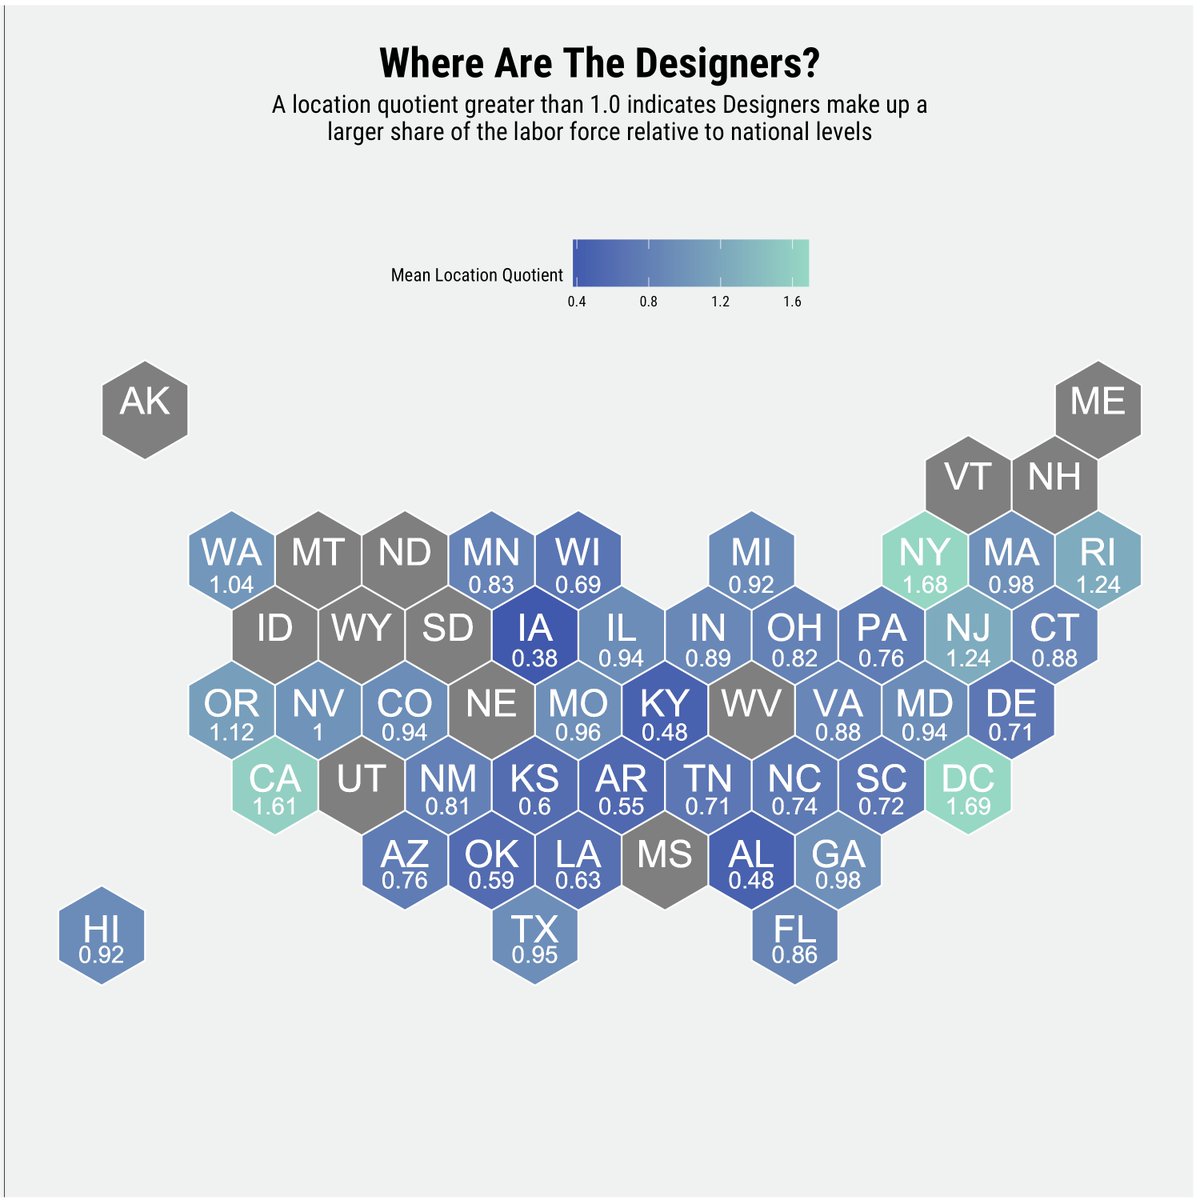
Another try at a hex bin map for #TidyTuesday. This time looking at the average location quotient for each state for designers. #RStats#dataviz
Code: https://t.co/N7LavrjO56
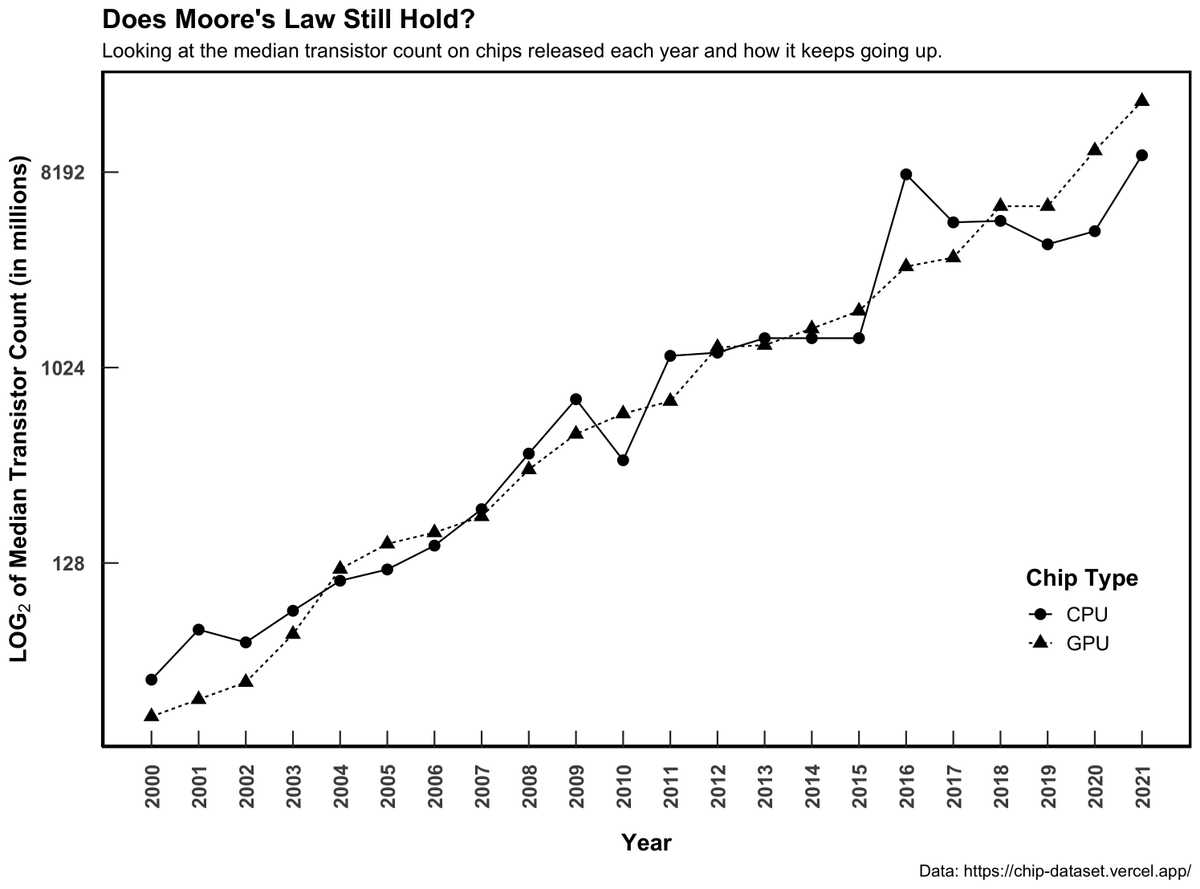
For #TidyTuesday, I tried to look at the median transistor count in a similar style to Moore's original graph from 1965. #MooresLaw#DataViz#RStats
Code: https://t.co/OFXQKyQNJb
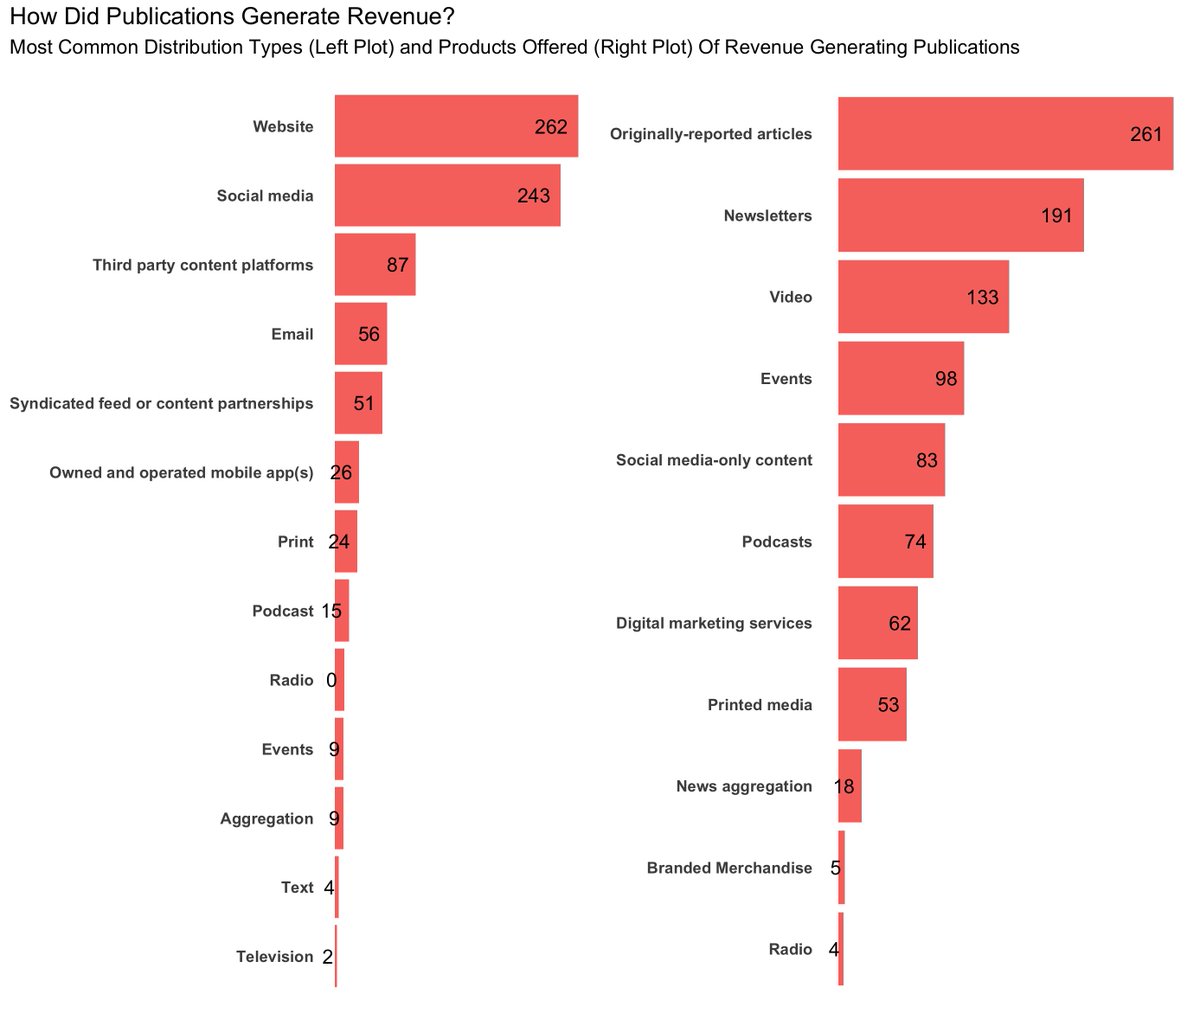
Looking at how publications can generate revenue for #TidyTuesday, in how they distribute content and offer products #RStats#dataviz
Code: https://t.co/jX7m0jJHfZ
Looking at my home state for #TidyTuesday. A plot of how many stations offer each type of alternative fuel and where they're at on the map. #RStats#dataviz
Code: https://t.co/kUai3nv77o
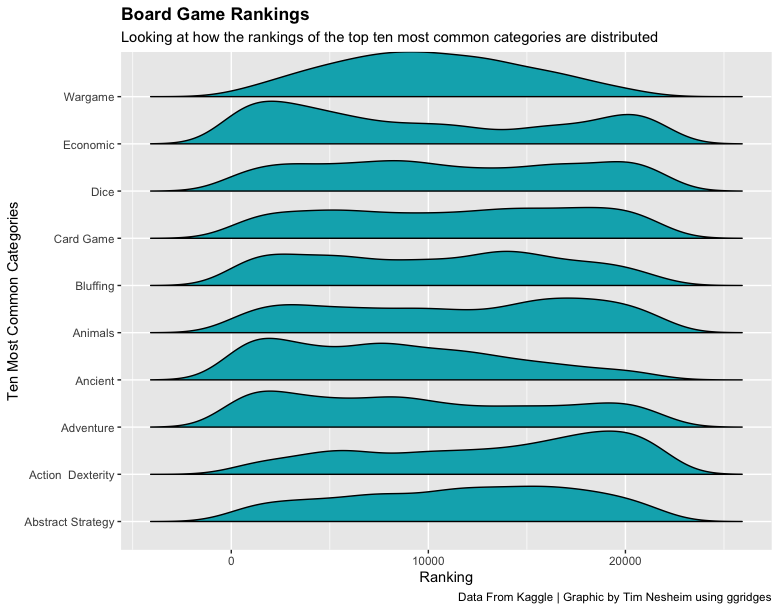
Another try at #TidyTuesday. Using data from @BoardGameGeek, I attempted to visualize the distributions of rankings for the top ten most common game categories. #RStats#dataviz
Code: https://t.co/vO8OxAIuGR