Day 30 of #COESISKnowledgeQuest
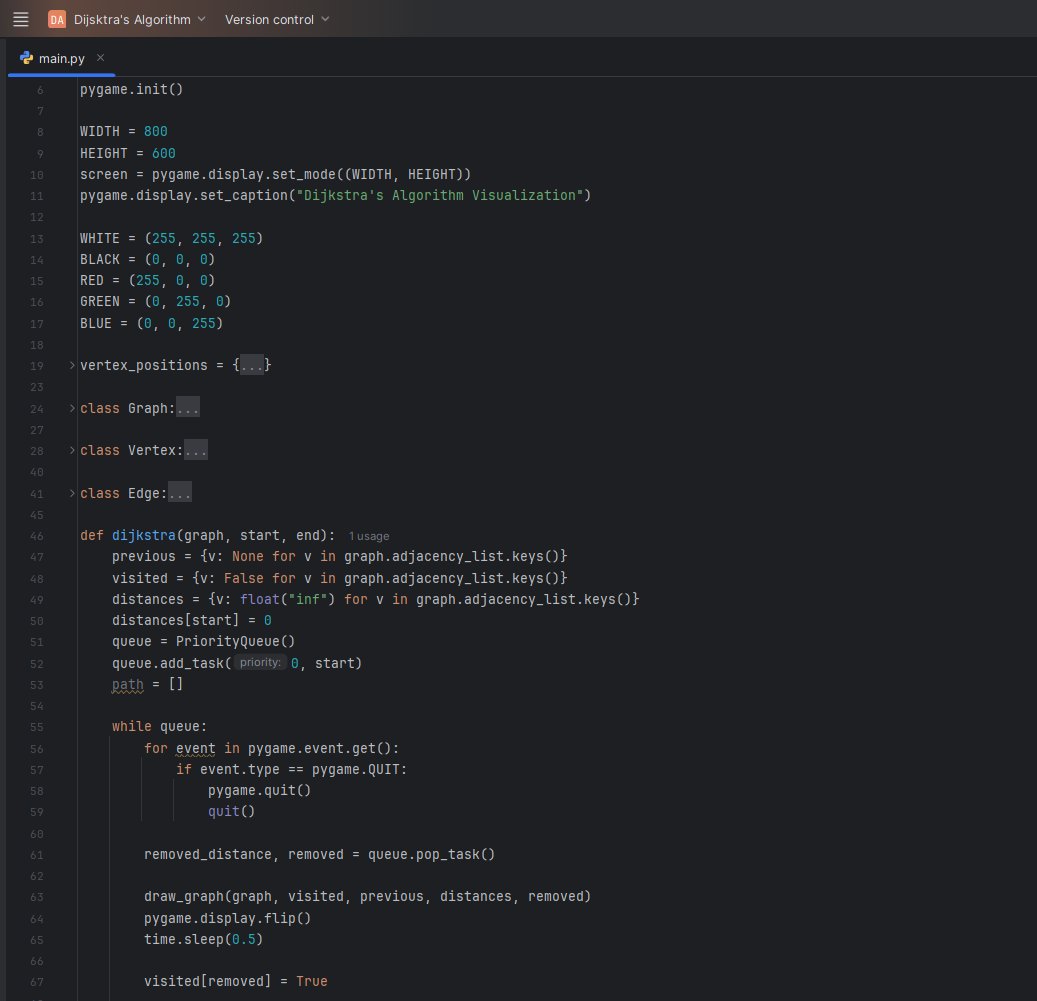
On the final day of my 30-day learning challenge with COESIS, I completed my Route Optimizer with some final touches. I implemented algorithm visualization using pygame in Python, making it more interactive.
#30daysoflearning#COESIS@coesisnp
Day 29 of #COESISKnowledgeQuest
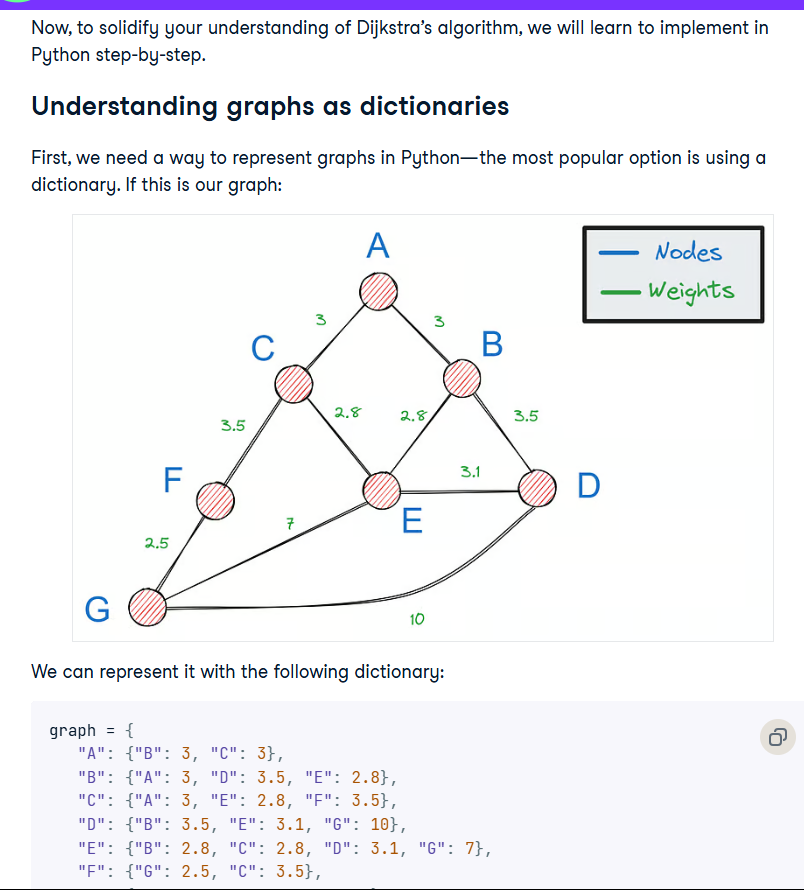
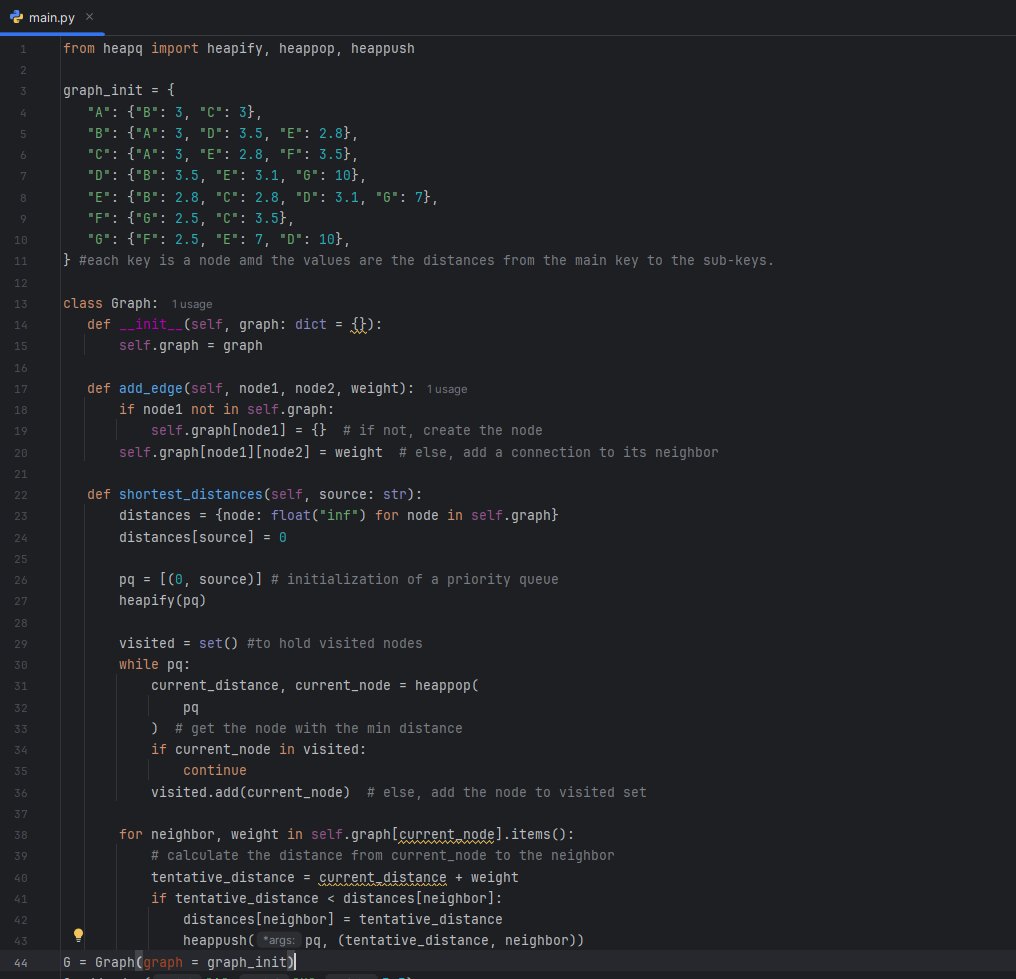
I learned to implement basic route optimization using Dijkstra's algorithm, which currently calculates the shortest distance and path between a given start and end node. I plan to further modify this program.
#30daysoflearning#COESIS@coesisnp
Day 28 of #COESISKnowledgeQuest
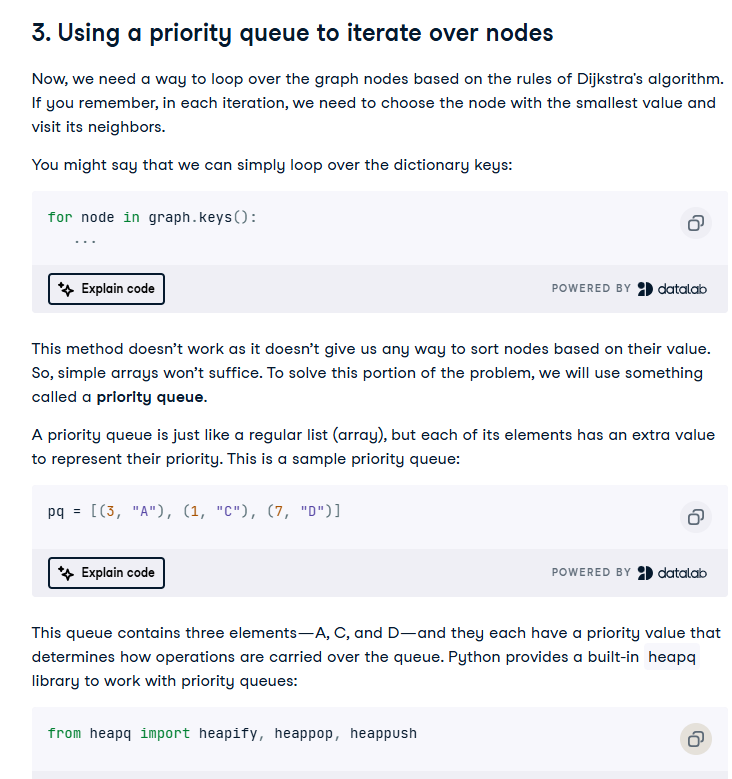
Today I started learning the implementation of Dijkstra's algorithm, how to create dictionaries for nodes and vertices, add edges, initialize shortest distances, and use the heapq library for priority queues.
#30daysoflearning#COESIS@coesisnp
Day 27 of #COESISKnowledgeQuest
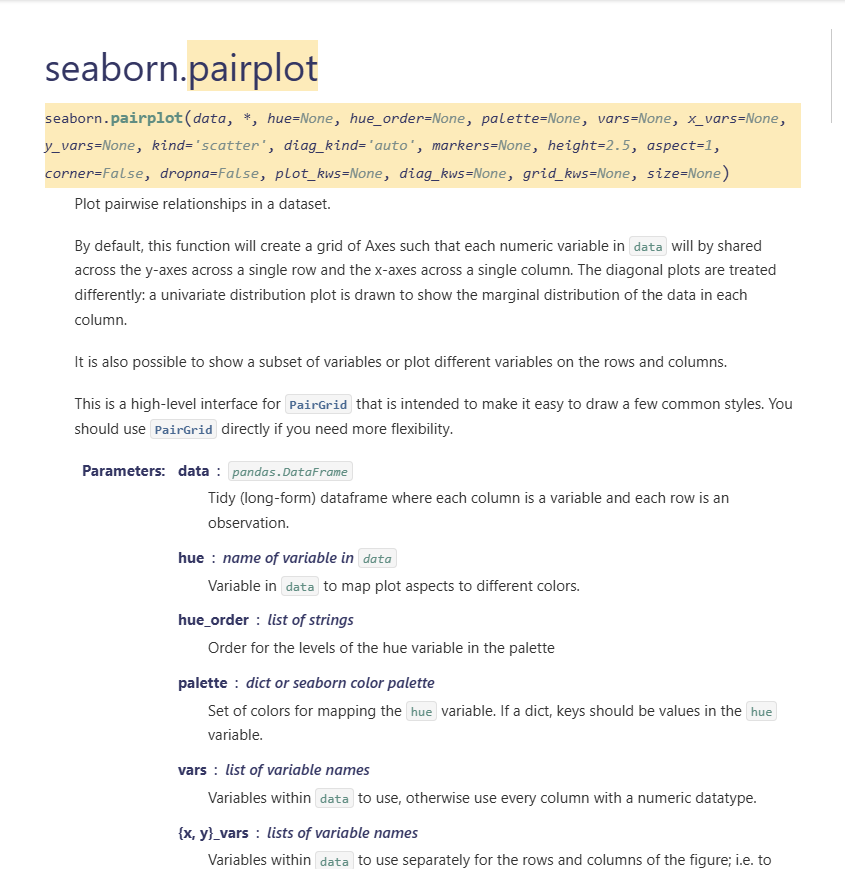
Today, I learned how to use pair plots to study relationships between variables in a dataset. Additionally, I created box plots to effectively visualize the distribution of different dataset variables
#30daysoflearning#COESIS@coesisnp
Day 26 of #COESISKnowledgeQuest
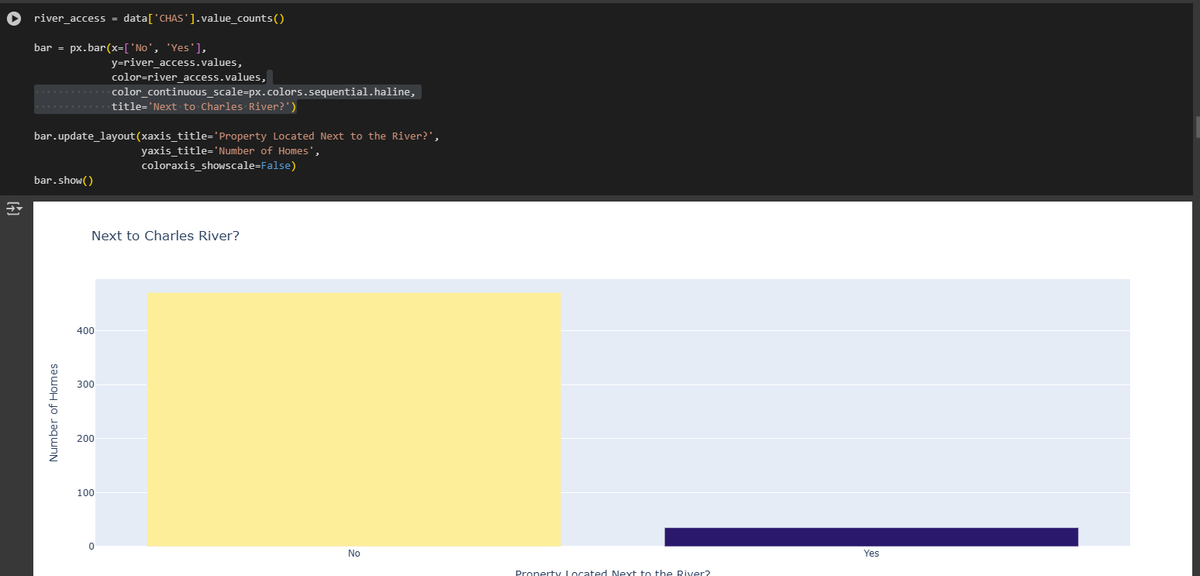
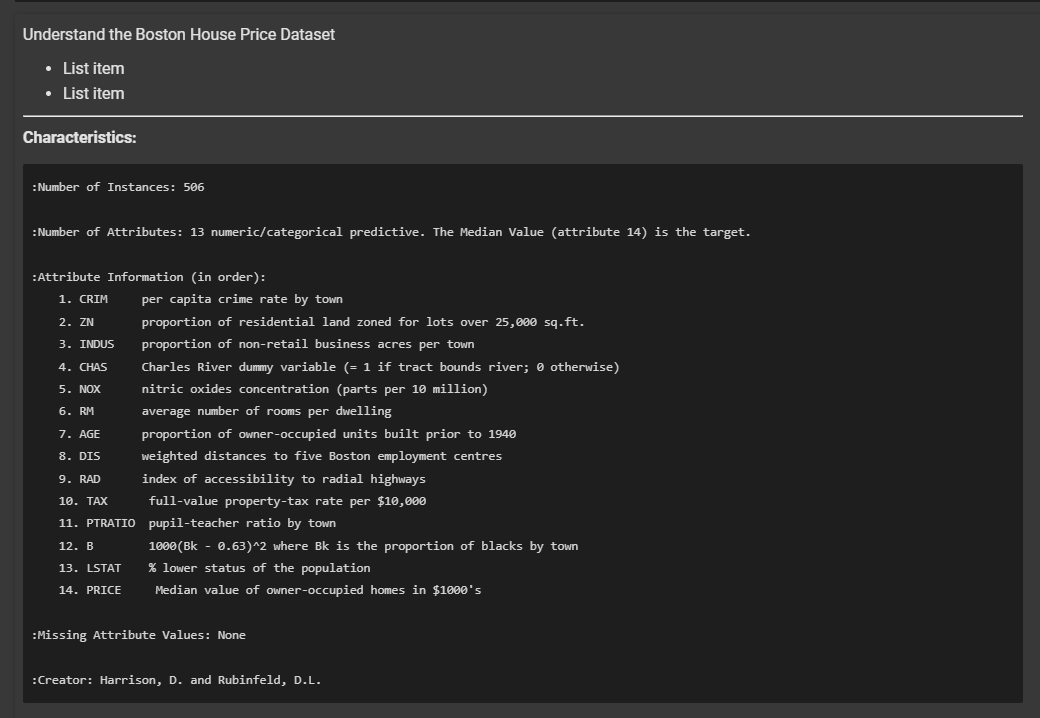
Today, I started a mini-project to build a model that estimates home prices based on key characteristics like the number of rooms, proximity to employment centers, neighborhood wealth.
#30daysoflearning#COESIS@coesisnp
Day 25 of #COESISKnowledgeQuest
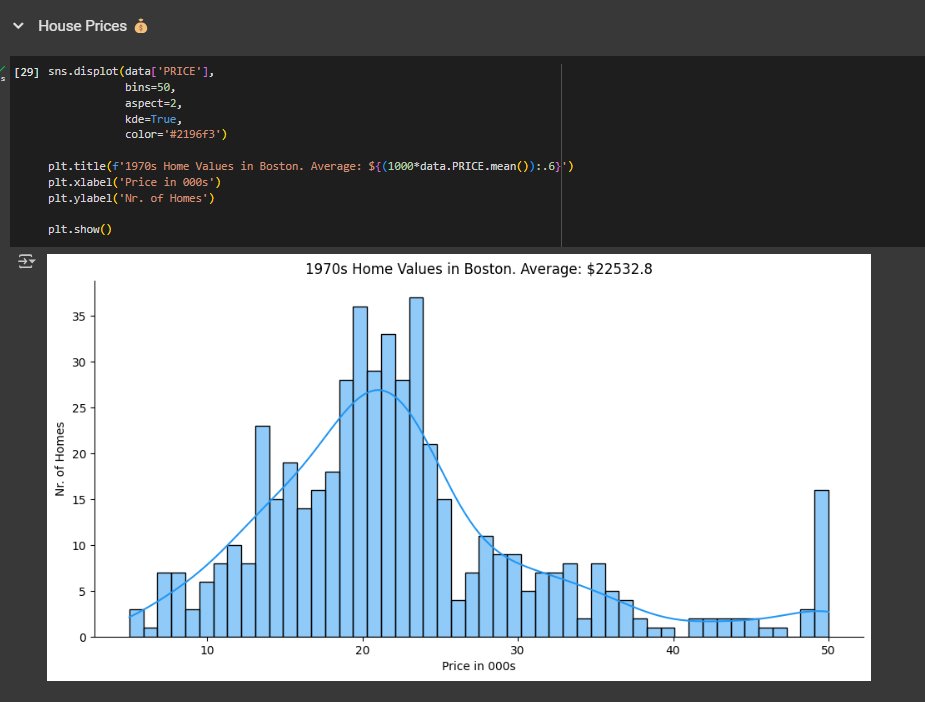
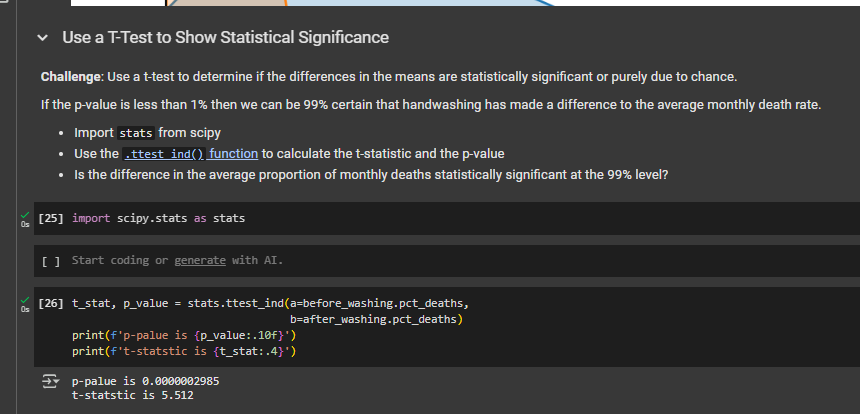
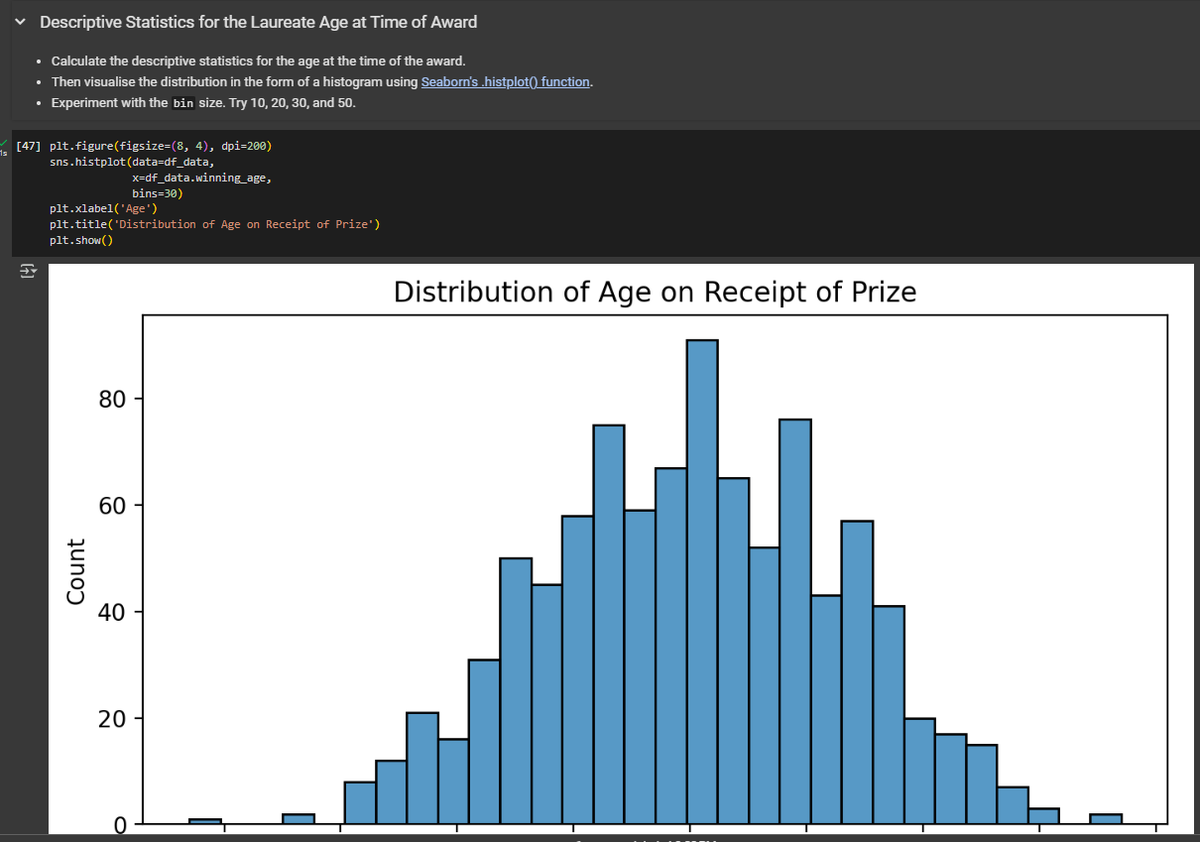
Today, I learned how to use a T-test to determine statistical significance, which helps compare sample means. I also explored visualizing data distributions using box plots and histograms.
#30daysoflearning#COESIS@coesisnp
Day 24 of #COESISKnowledgeQuest
Today, I applied what I’ve learned over the past few days by analyzing data from Dr. Semmelweis’s handwashing study. I examined patterns and trends, exploring how key variables changed over time.
#30daysoflearning#COESIS@coesisnp
Day 23 of #COESISKnowledgeQuest
Today, I learned to create Sunburst charts for a detailed regional breakdown of research locations. I also used Seaborn's regplot() to add trendlines to scatter plots.
#30daysoflearning#COESIS@coesisnp
Day 22 of #COESISKnowledgeQuest
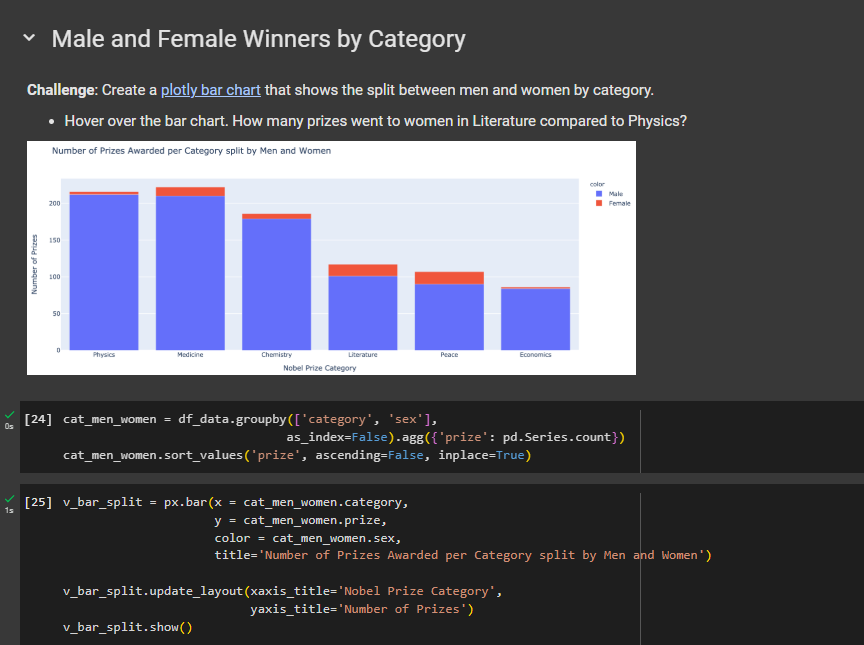
Today, I learned to create choropleth maps and reinforced previous concepts by analyzing the Nobel Prize dataset. Using Plotly and Matplotlib, I visualized award trends through donut and bar charts.
#30daysoflearning#COESIS@coesisnp
Day 21 of #COESISKnowledgeQuest
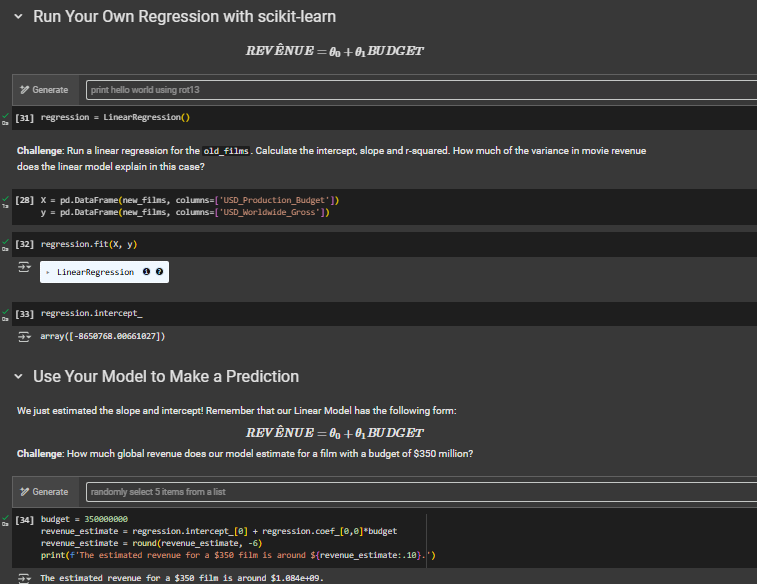
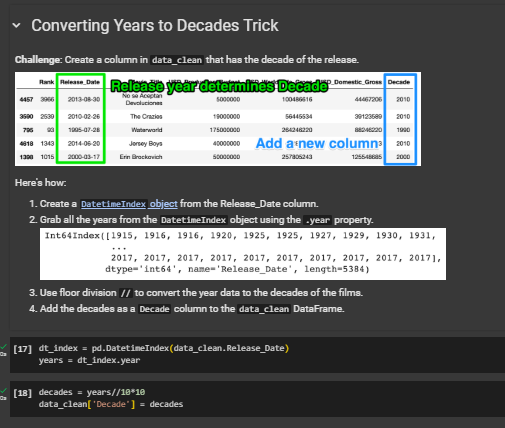
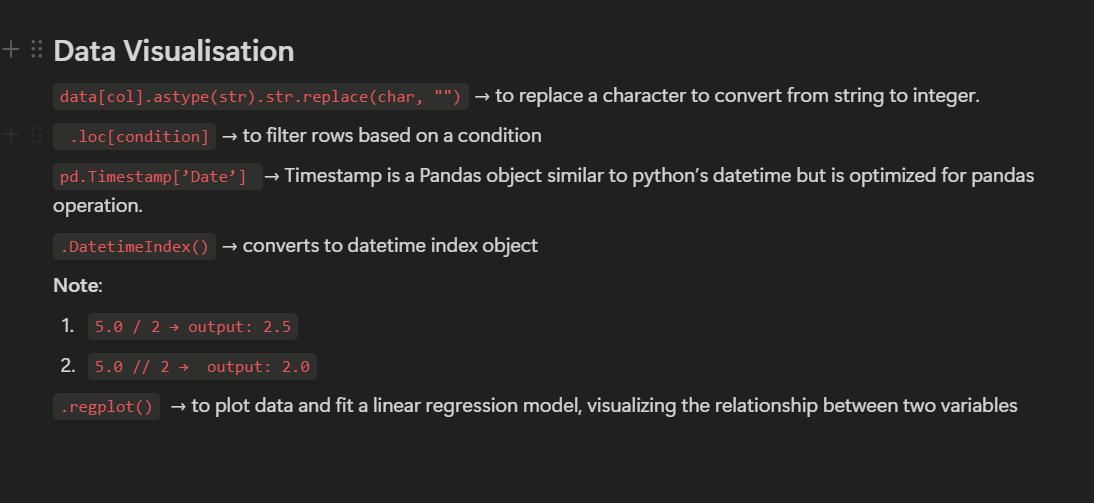
Today, I learned to use floor division to convert years into decades, plotted linear regressions with Seaborn for data visualization, and ran regression models using Scikit-learn for predictive analysis.
#30daysoflearning#COESIS@coesisnp
Day 20 of #COESISKnowledgeQuest
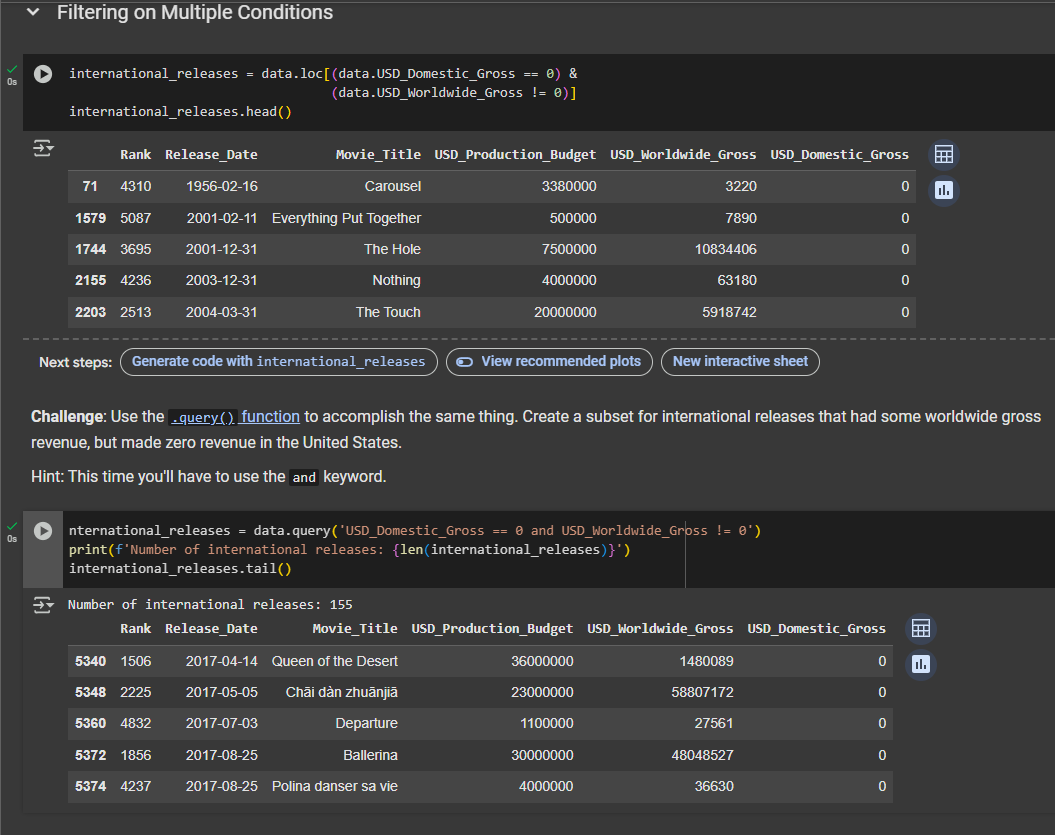
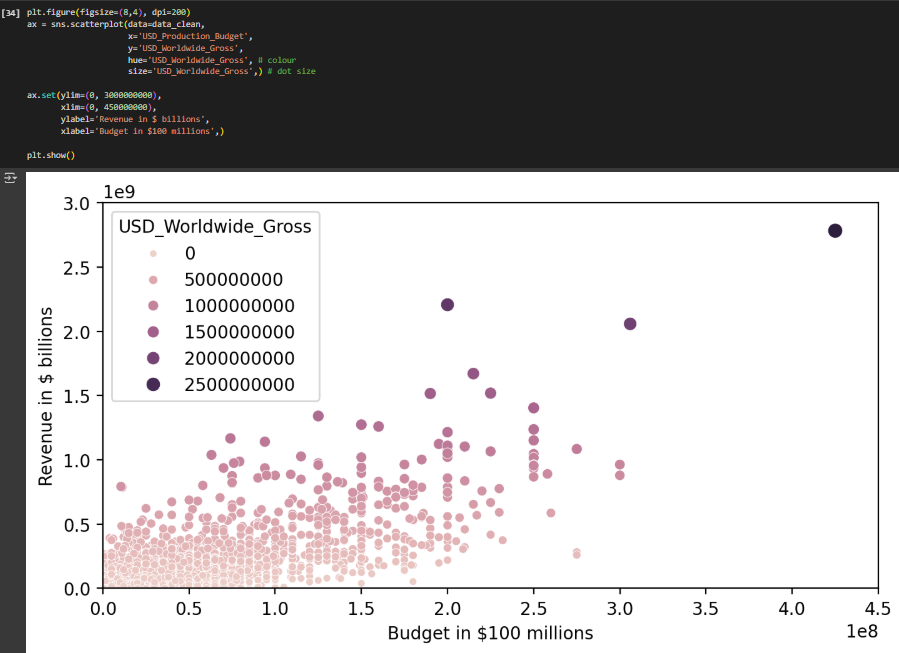
Today, I learned how to filter data based on multiple conditions in Pandas, enabling more precise data analysis. I also explored data visualization techniques using Seaborn, including creating bubble charts.
#30daysoflearning#COESIS@coesisnp
Day 19 of #COESISKnowledgeQuest
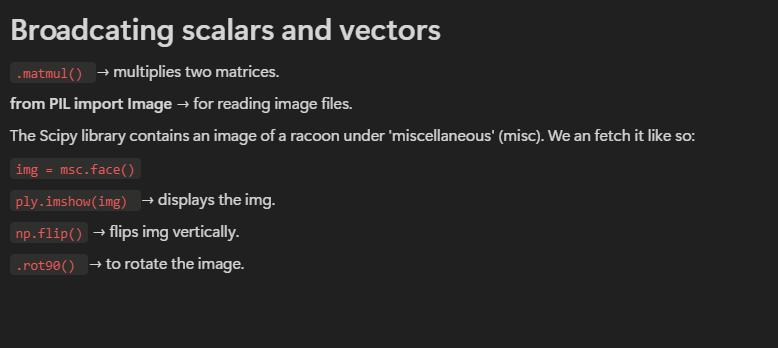
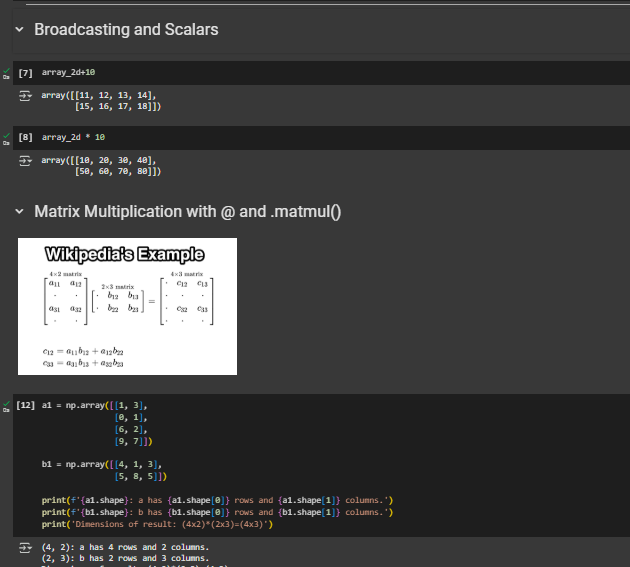
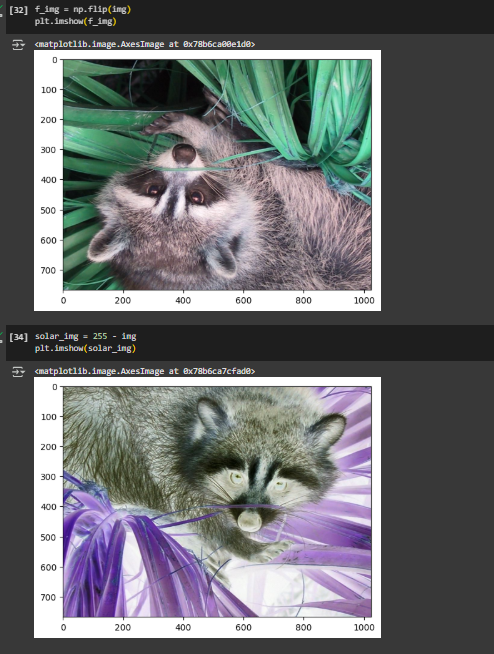
Today, I learned about broadcasting, which simplifies operations between arrays, and scalars in computations, matrix multiplication, and manipulating images as ndarrays for efficient visual data processing.
#30daysoflearning#COESIS@coesisnp
Day 18 of #COESISKnowledgeQuest
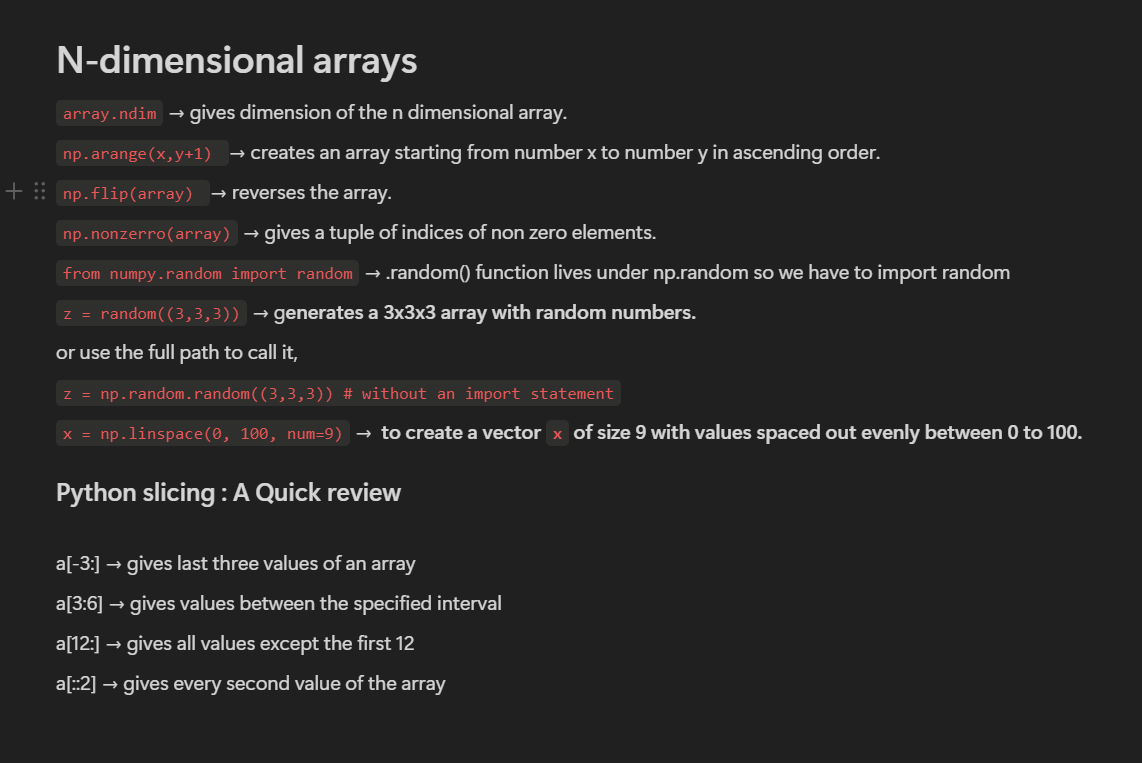
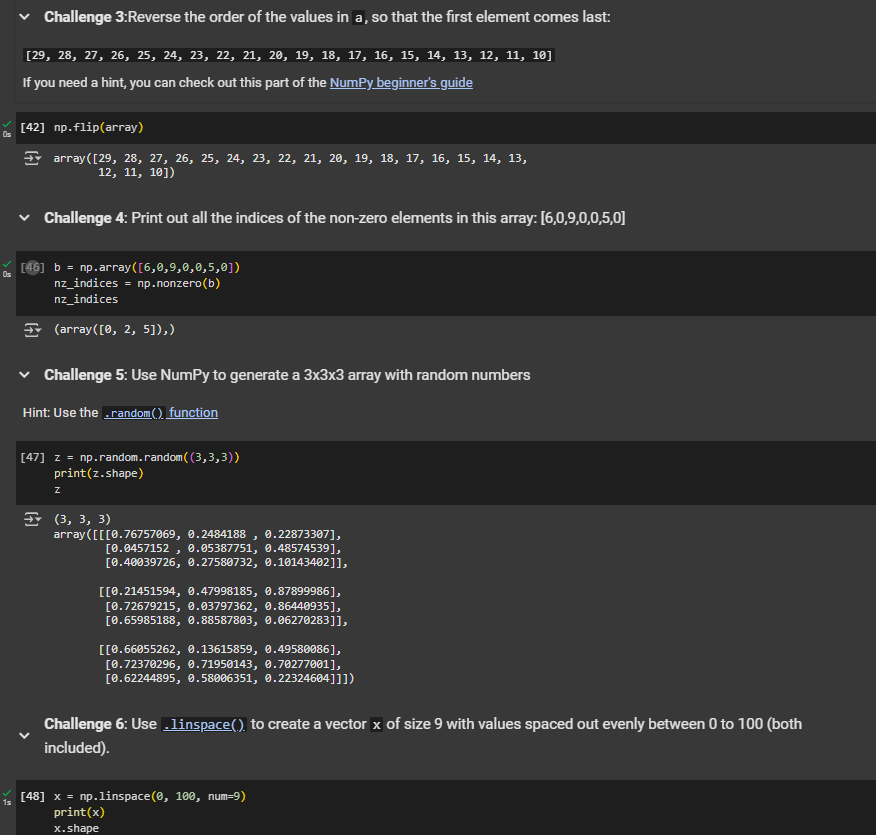
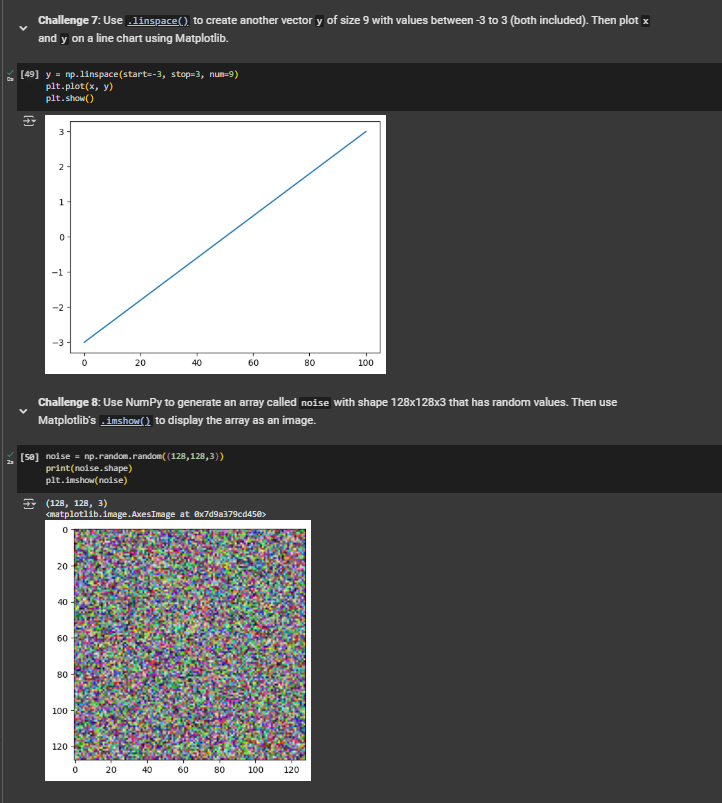
Today I learned about n-dimensional arrays using NumPy, including how to generate and manipulate ndarray objects . I revisited Python slicing techniques for handling data in multi-dimensional spaces.
#30daysoflearning#COESIS@coesisnp
Day 17 of #COESISKnowledgeQuest
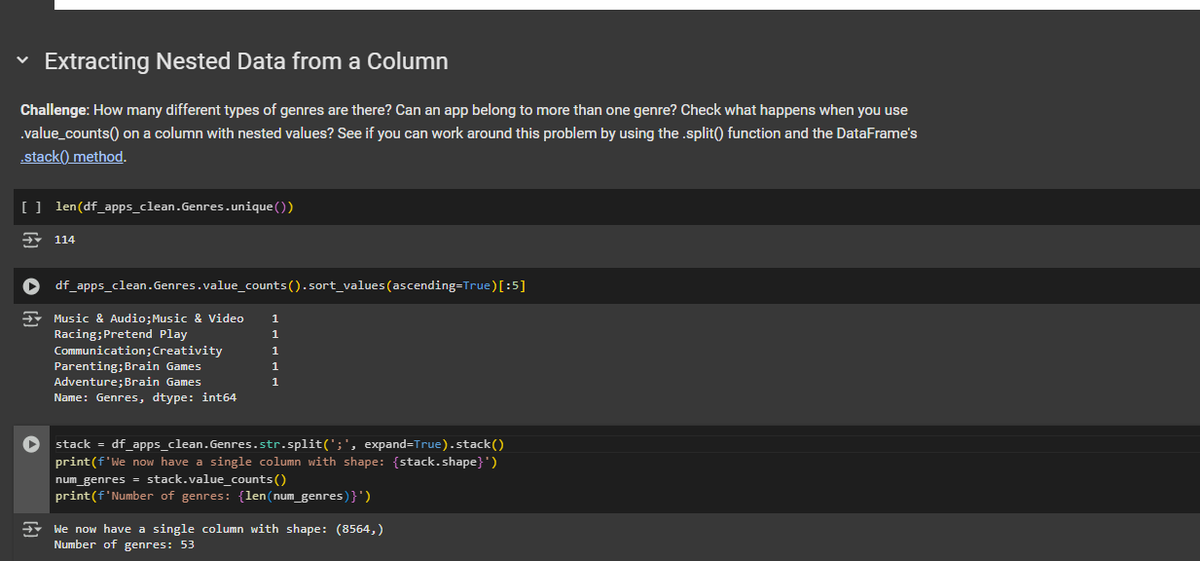
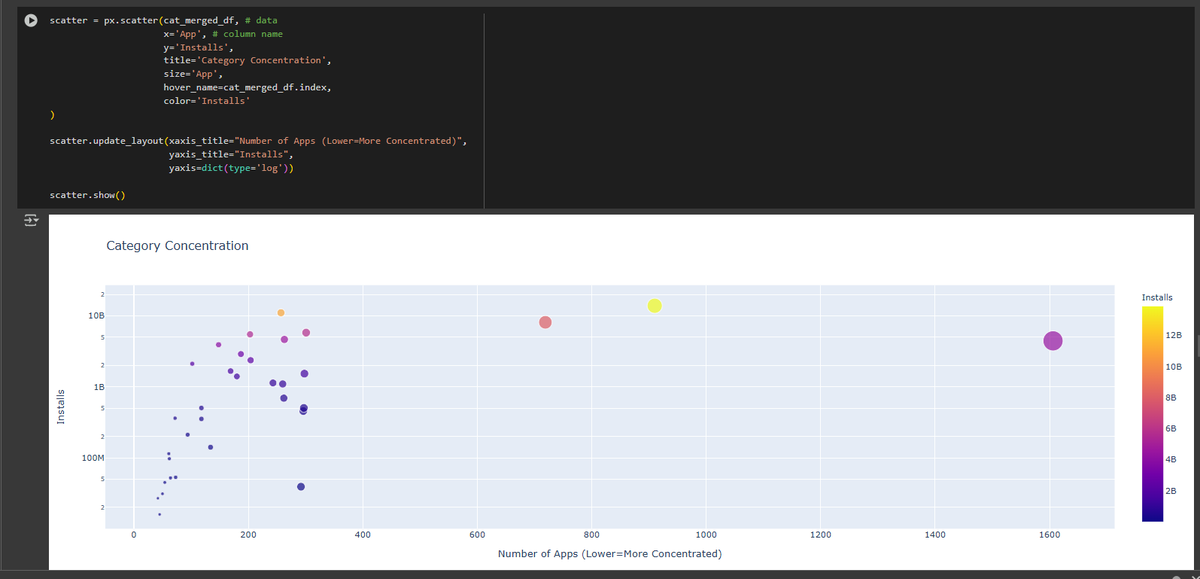
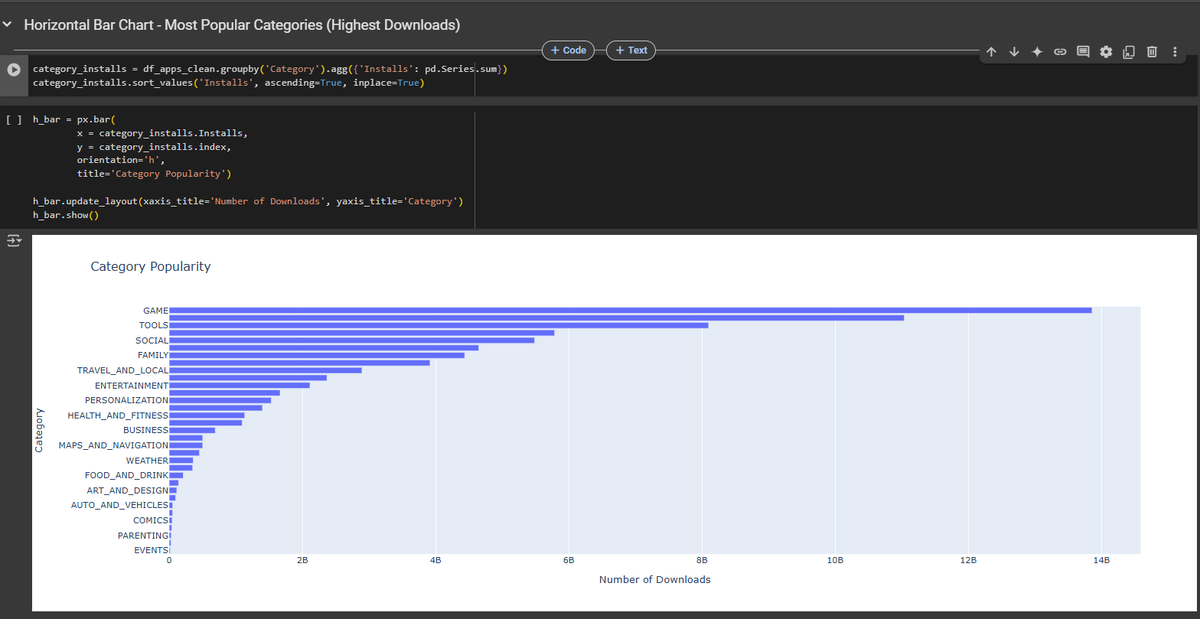
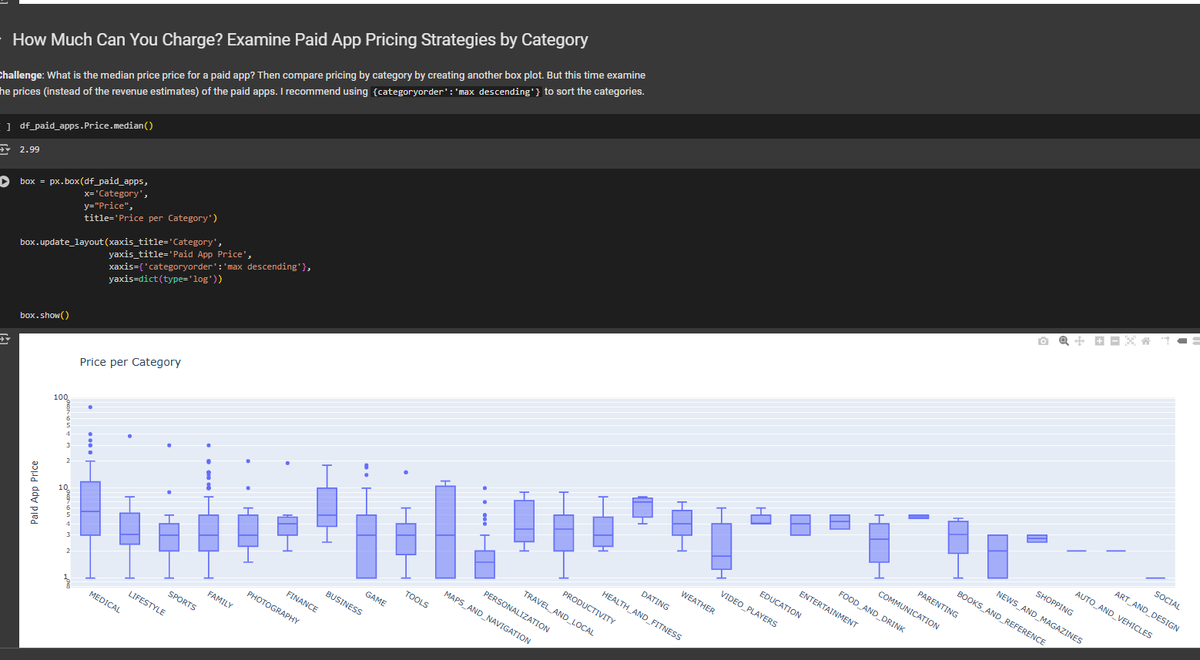
Today, I learned how to extract nested column data using .stack(). I also created grouped bar charts , scatter plots and box plots with Plotly for popular app categories.
#30daysoflearning#COESIS@coesisnp
Day 16 of #COESISKnowledgeQuest
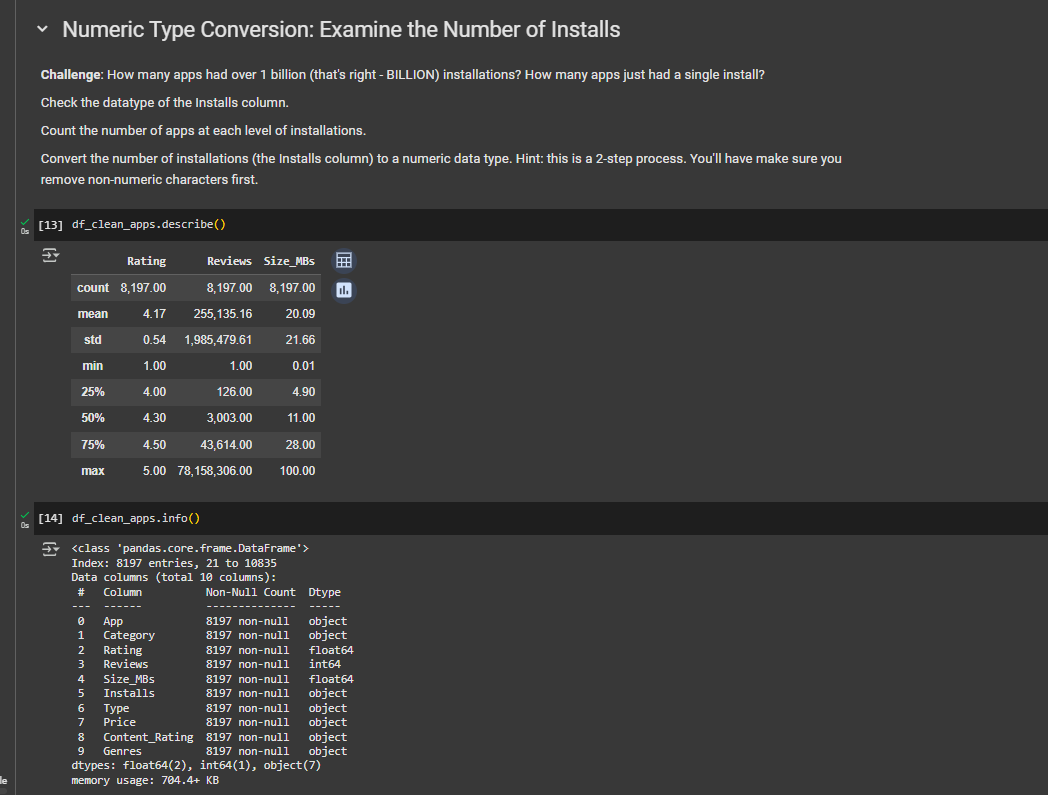
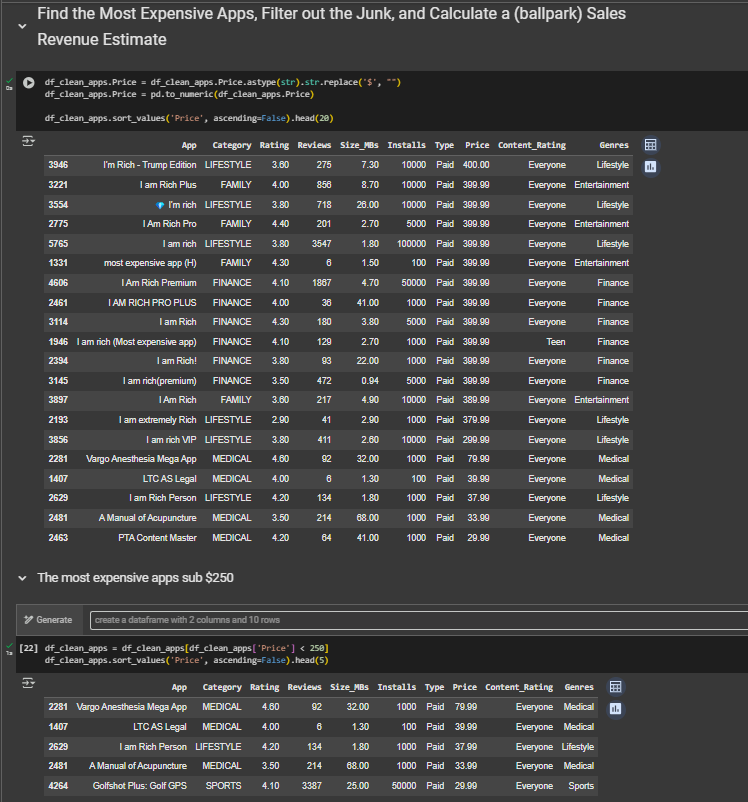
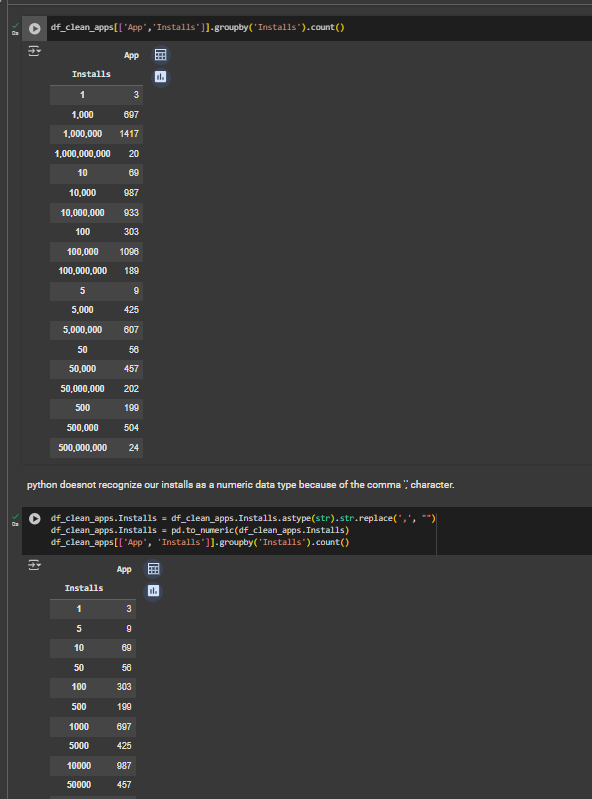
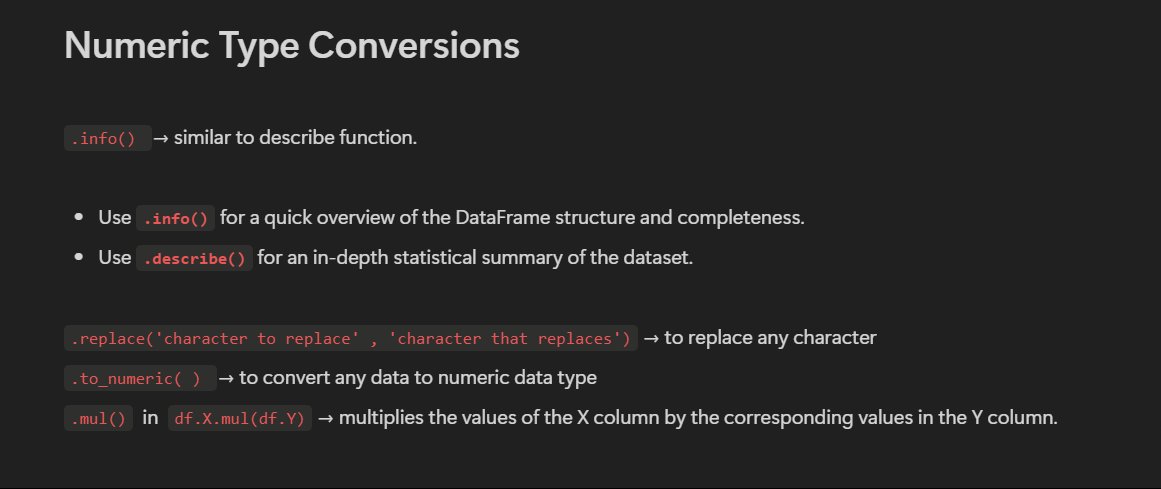
Today, I learned about numeric type conversions, including how to check the data types of columns, convert non-numeric data into numeric types, and filter out manipulated data effectively.
#30daysoflearning#COESIS@coesisnp
Day 15 of #COESISKnowledgeQuest
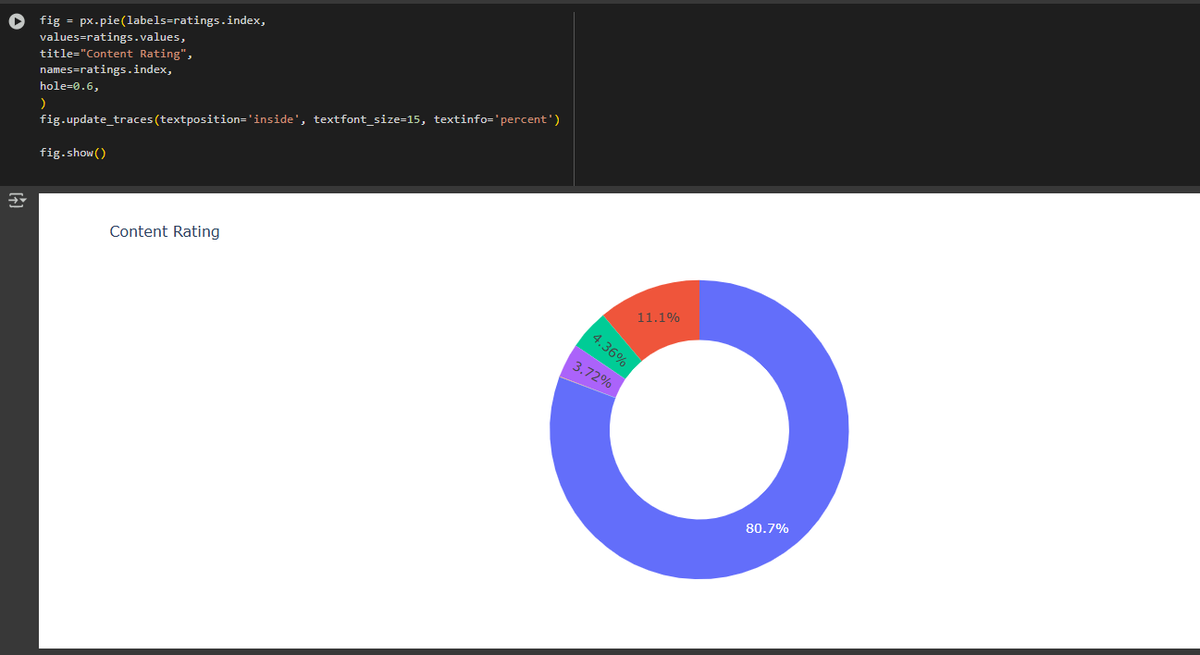
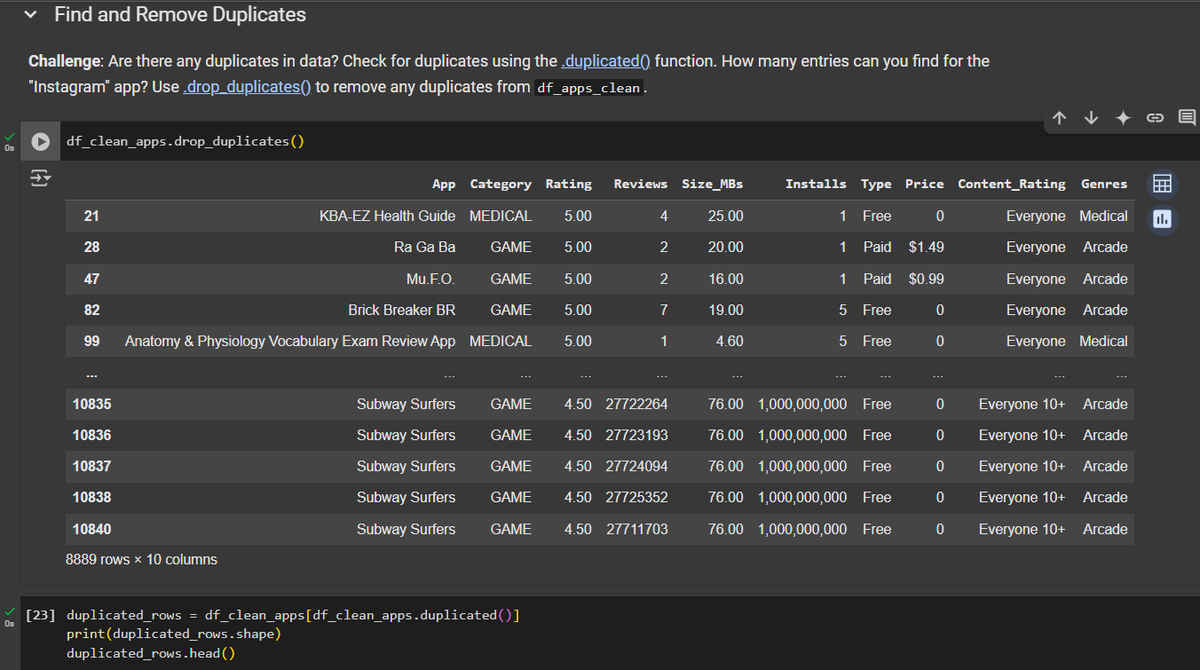
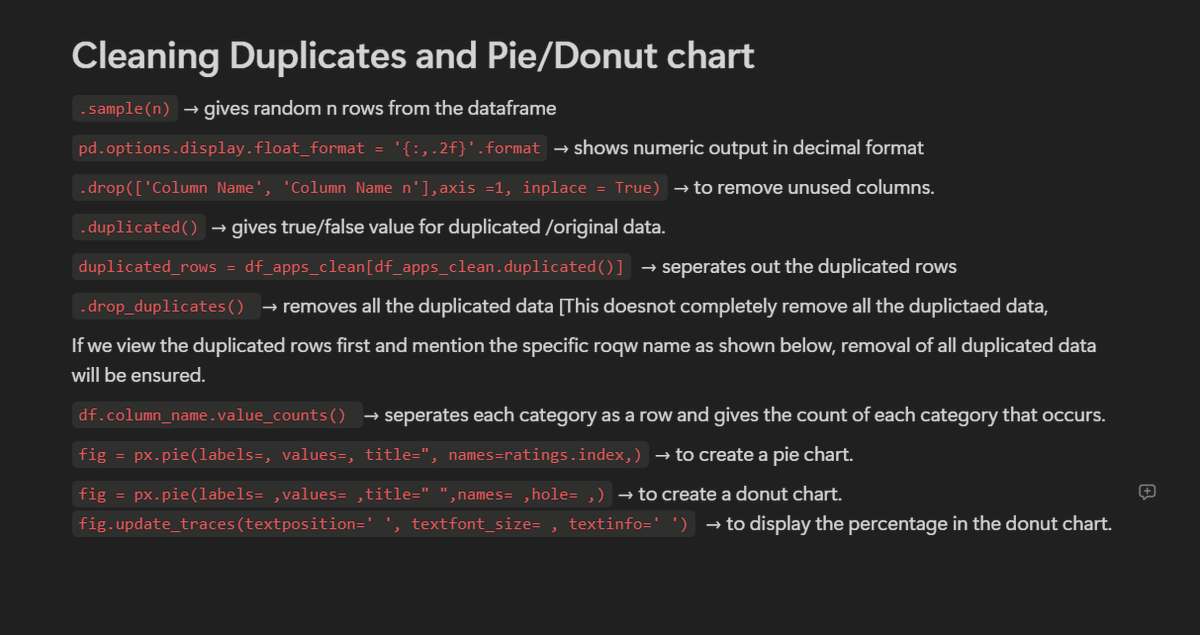
Today, I learned to remove unused columns and duplicate data, evaluated the competitiveness of various apps across different categories, and created donut and pie charts using Plotly for visualization.
#30daysoflearning#COESIS@coesisnp
Day 14 of #COESISKnowledgeQuest
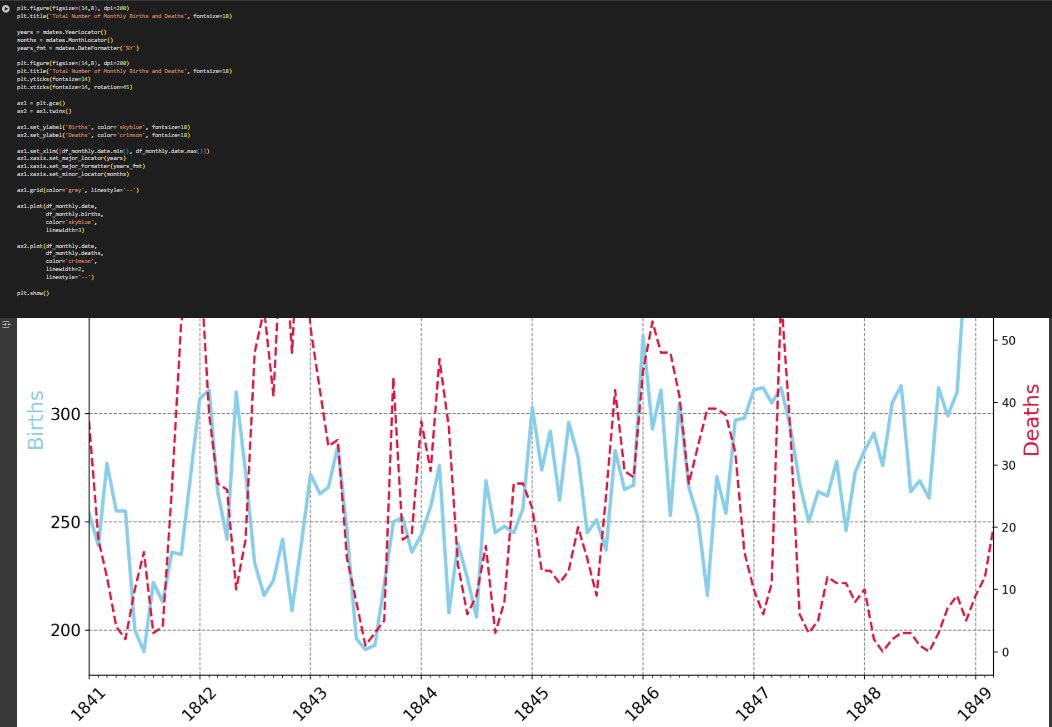
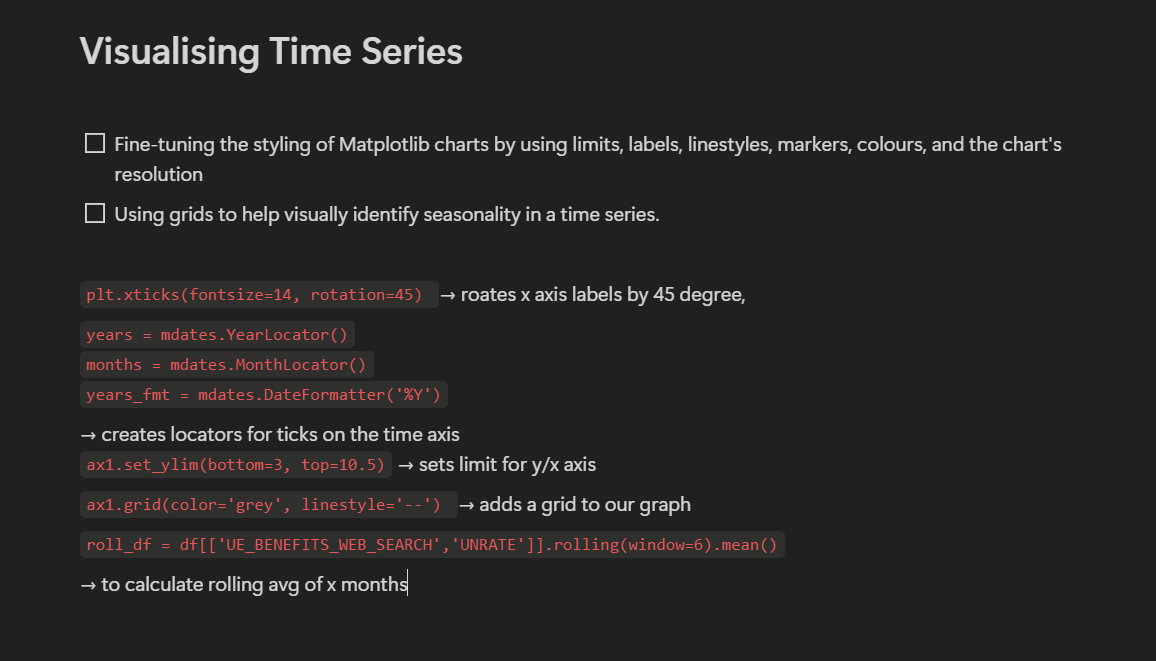
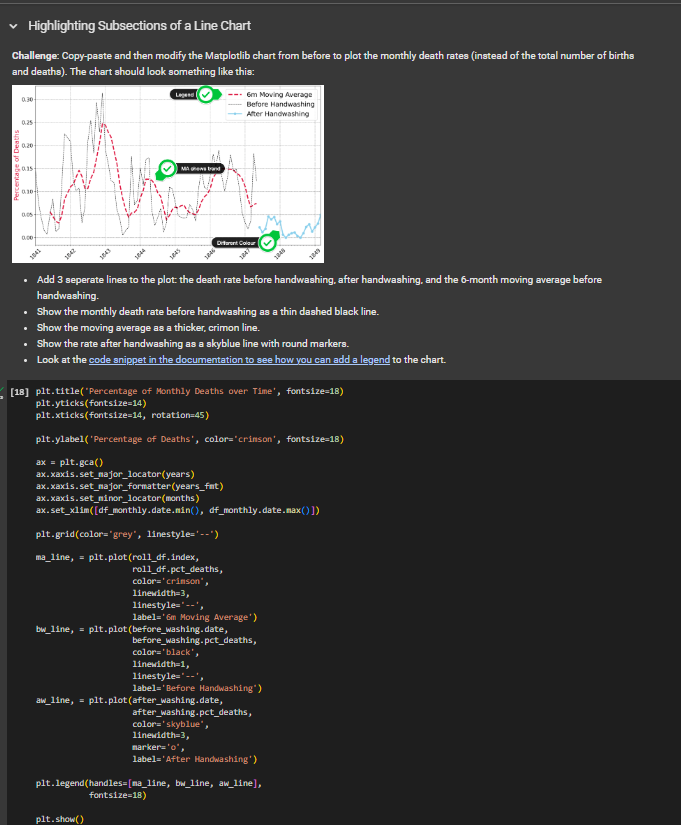
Today, I learned to fine-tune Matplotlib charts by adjusting limits, labels and resolution, use grids to visually identify seasonality in time series data and calculate rolling averages.
#30daysoflearning#COESIS@coesisnp
Day 13 of #COESISKnowledgeQuest
Today learned about making time-series data comparable by resampling and converting it to the same periodicity using the .resample() method and harmonized datasets into a common frequency.
#30daysoflearning#COESIS@coesisnp
Day 12 of #COESISKnowledgeQuest
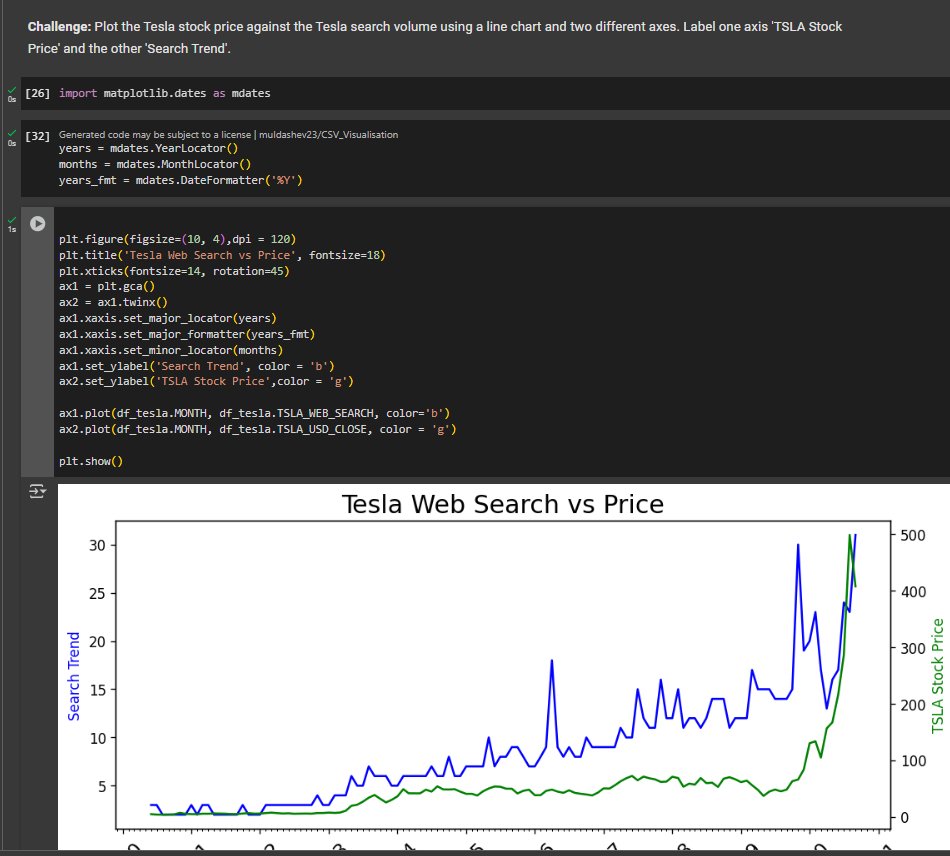
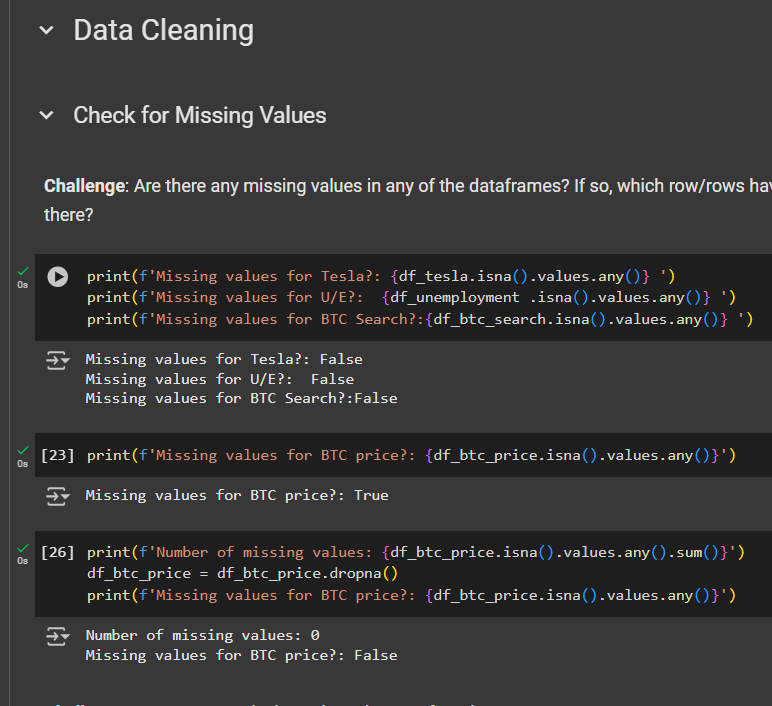
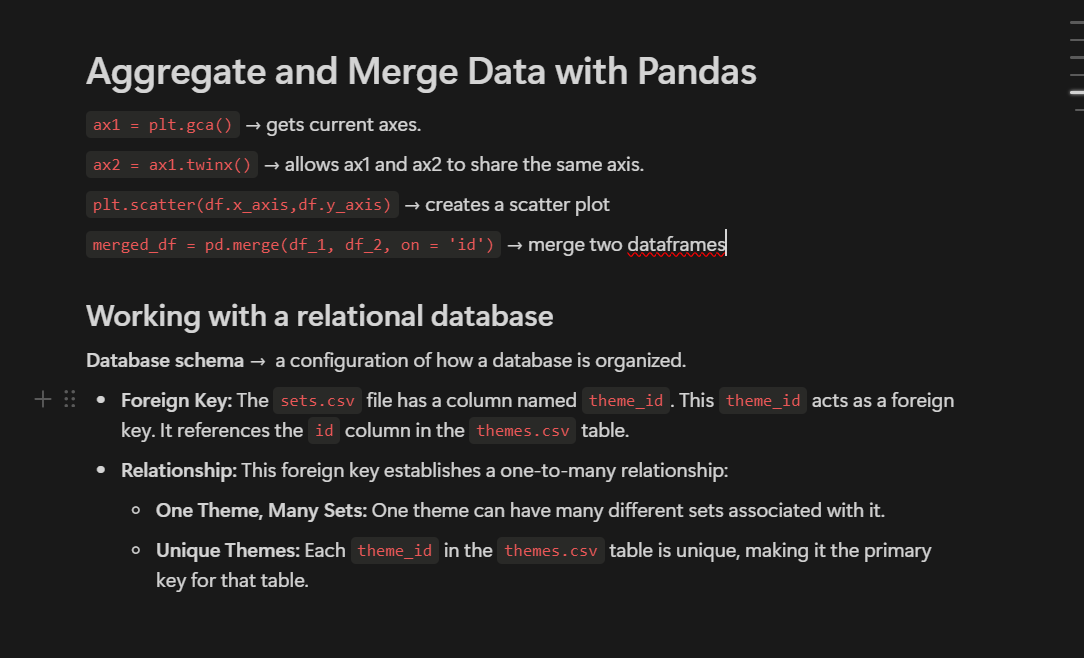
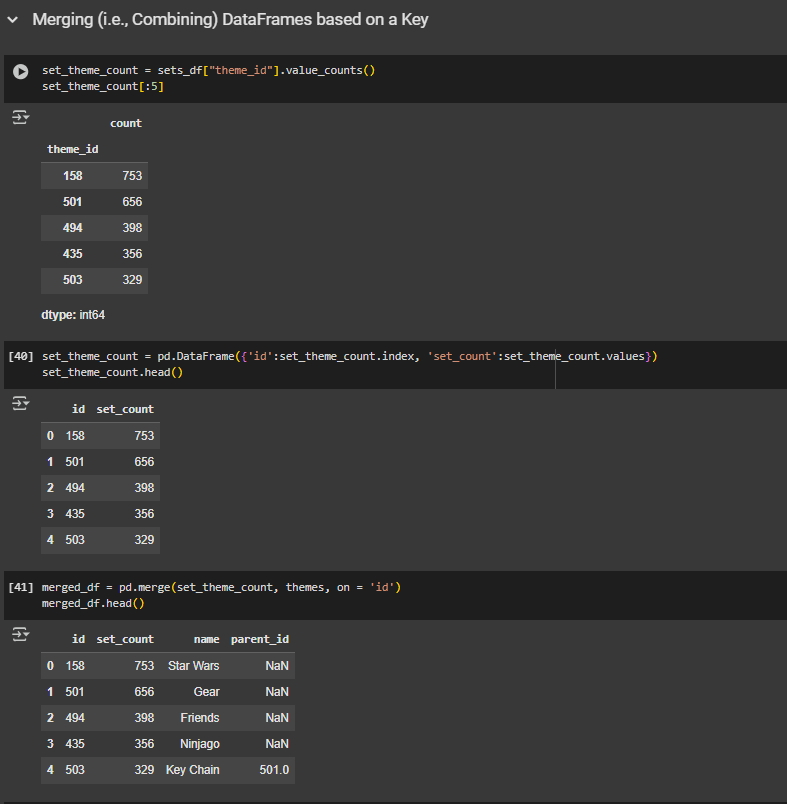
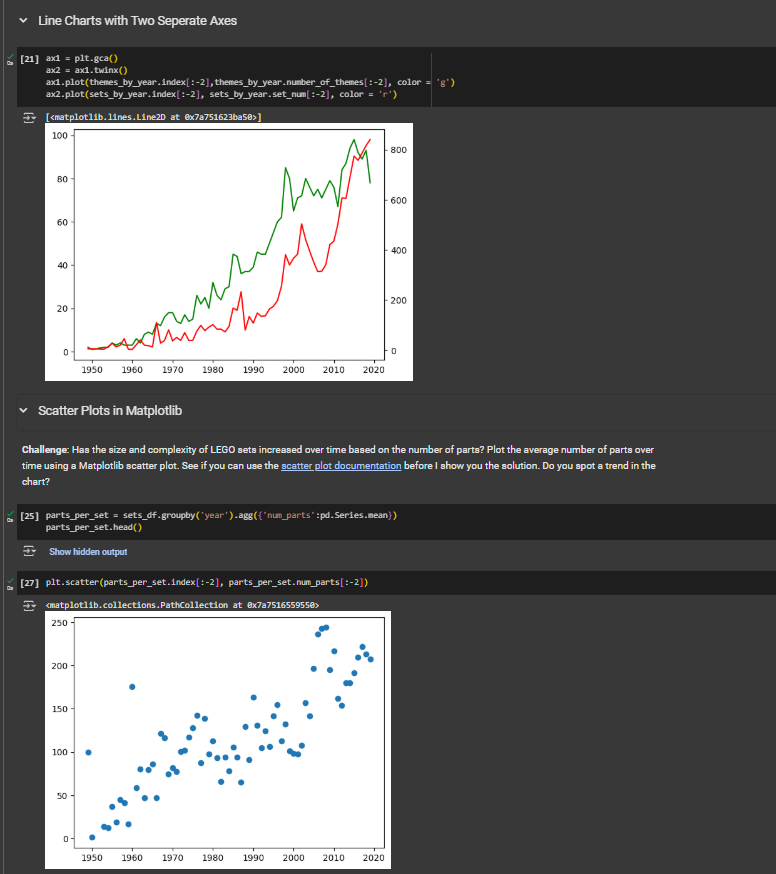
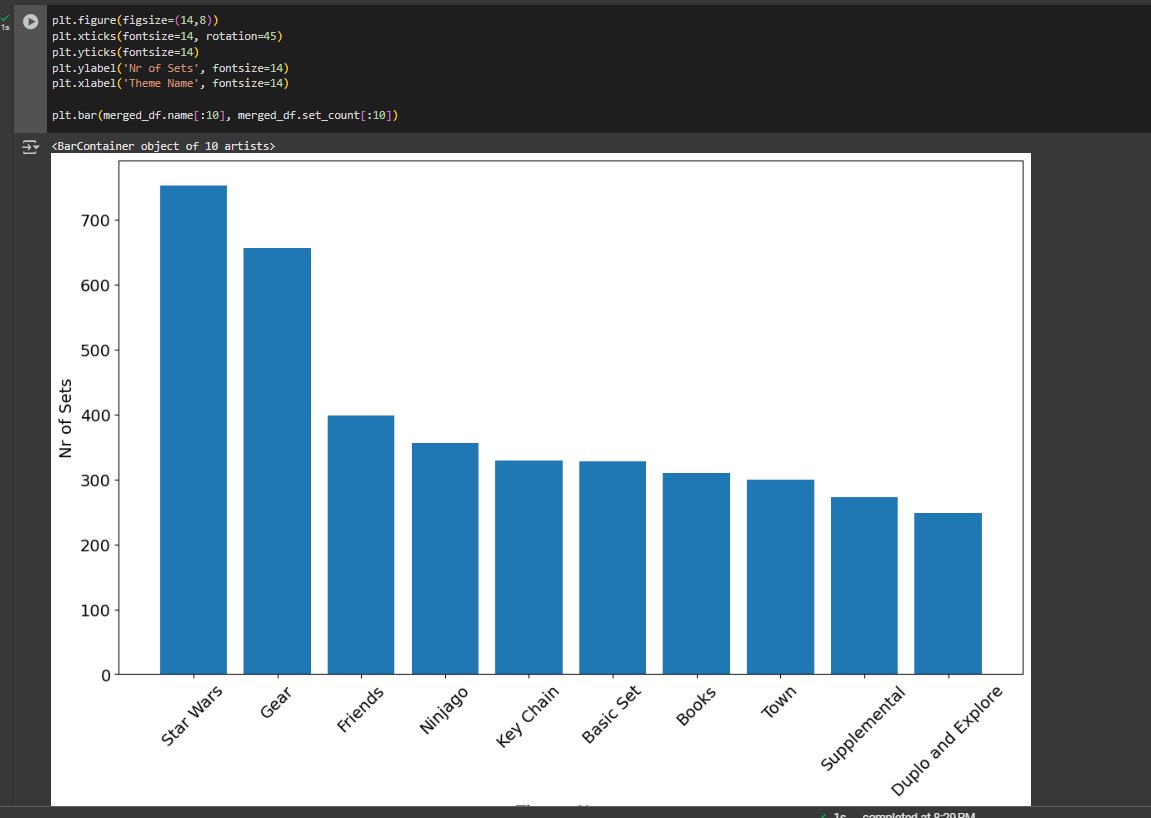
Today, I learned to superimpose line charts with separate axes, create scatter plots, understand relational database schemas with primary and foreign keys, and merge data frames and create bar charts.
#30daysoflearning#COESIS@coesisnp
Day 11 of #COESISKnowledgeQuest
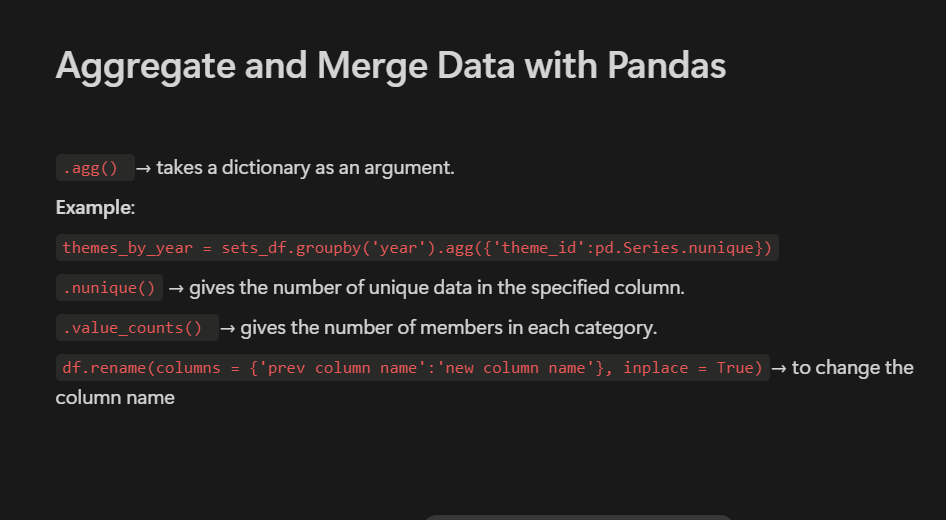
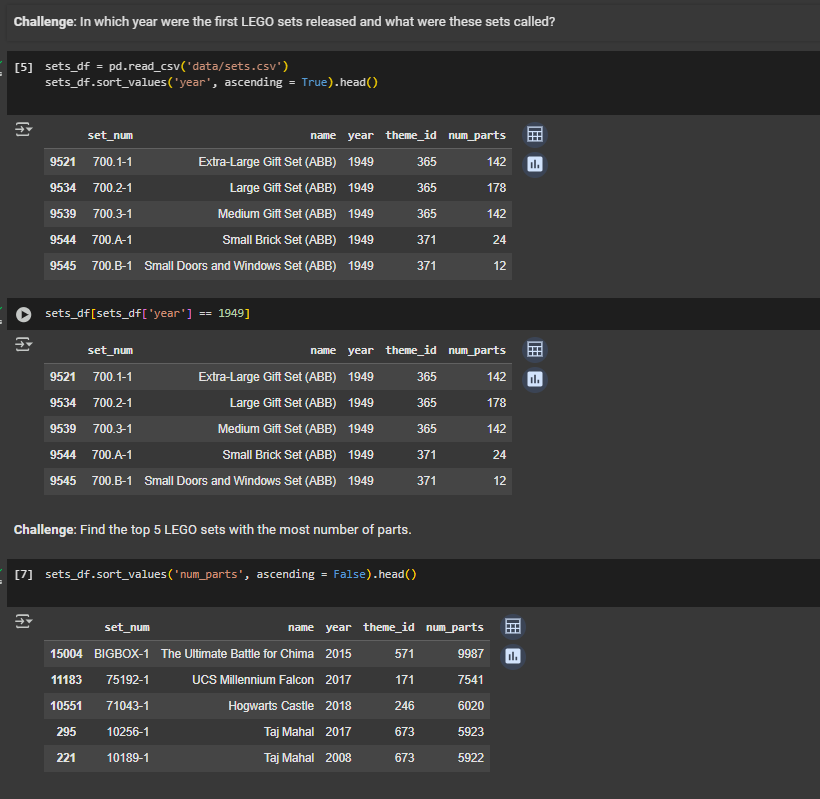
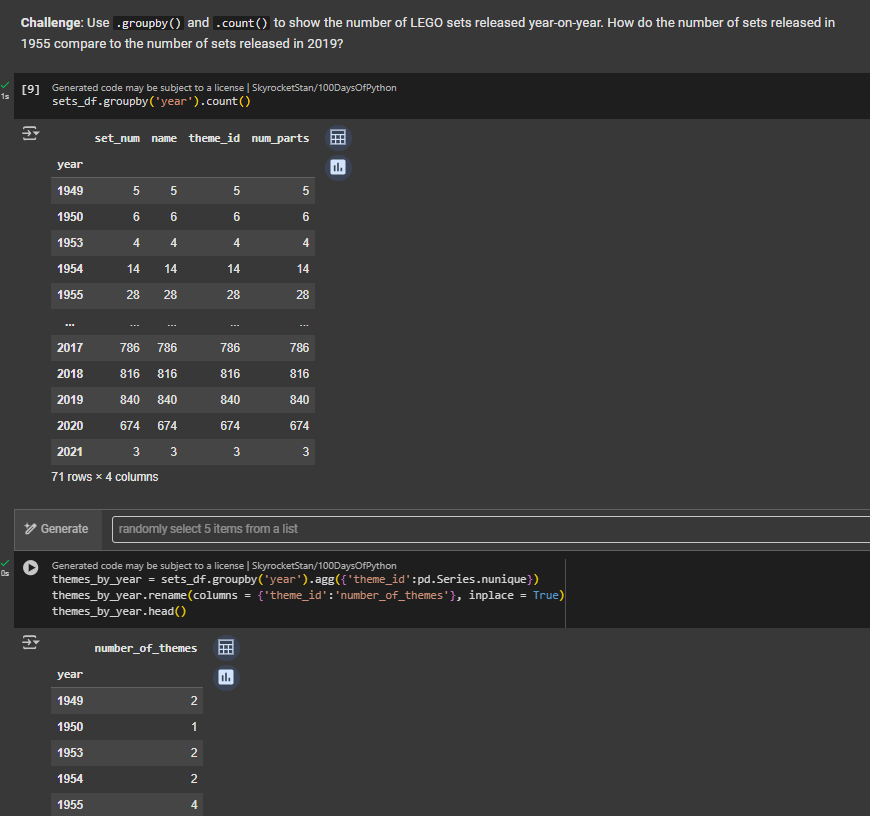
Today, I mastered the pandas .agg() method for data analysis. I analyzed a LEGO dataset to find the oldest sets, visualized the trend of LEGO sets over time, and created a line plot of LEGO themes.
#30daysoflearning#COESIS@coesisnp