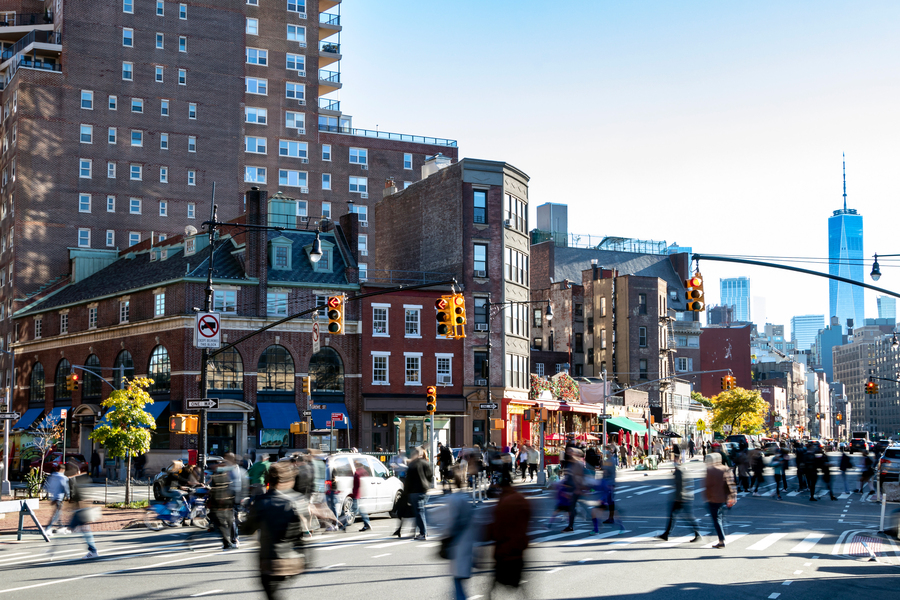
For decades, urban planners have rigorously tracked every car in New York City while completely ignoring the pedestrians.
An MIT research group has finally built the first complete model of foot traffic in an American city. They took baseline counts from the Department of Transportation and mapped a routable dataset covering every pavement, crosswalk, and footpath across the five boroughs. The resulting data exposes massive flaws in how cities allocate infrastructure funding.
Midtown Manhattan hits nearly 1,700 pedestrians per block per hour during peak times. Because officials see these massive raw numbers, they funnel the bulk of pedestrian safety investments directly into the city centre. The MIT model proves this bias is a mistake. Neighbourhoods in Brooklyn, Queens, and the Bronx routinely register hundreds of pedestrians per block per hour. People in these outer boroughs are walking in huge numbers, but they don't get the infrastructure to match.
The model also rewrites the maths on urban safety. Governments typically rank dangerous intersections by tallying up total crashes. High-traffic areas like Herald Square or Times Square rack up lots of accidents. Planners look at those totals and assume the area is highly dangerous for walkers.
The new system calculates risk on a per-pedestrian basis instead. When you divide the accidents by the millions of people walking through Midtown, the individual risk is actually very low. The true danger zones are around highway off-ramps and heavy car infrastructure in low-density areas like Staten Island. A pedestrian walking there faces a drastically higher statistical chance of being hit by a vehicle.
This framework changes how urban development works. Los Angeles is already applying the model to prepare its public transit and mobility networks for the 2028 Olympics. The state of Maine is using it to evaluate 140 different towns to identify necessary safety upgrades.
Planners finally have the hard data to prove what walkers have known for years. We spent the entire twentieth century designing our environment around the automobile. We finally have the tools to start building cities for people.
Link to paper: https://t.co/bUatVebqOj
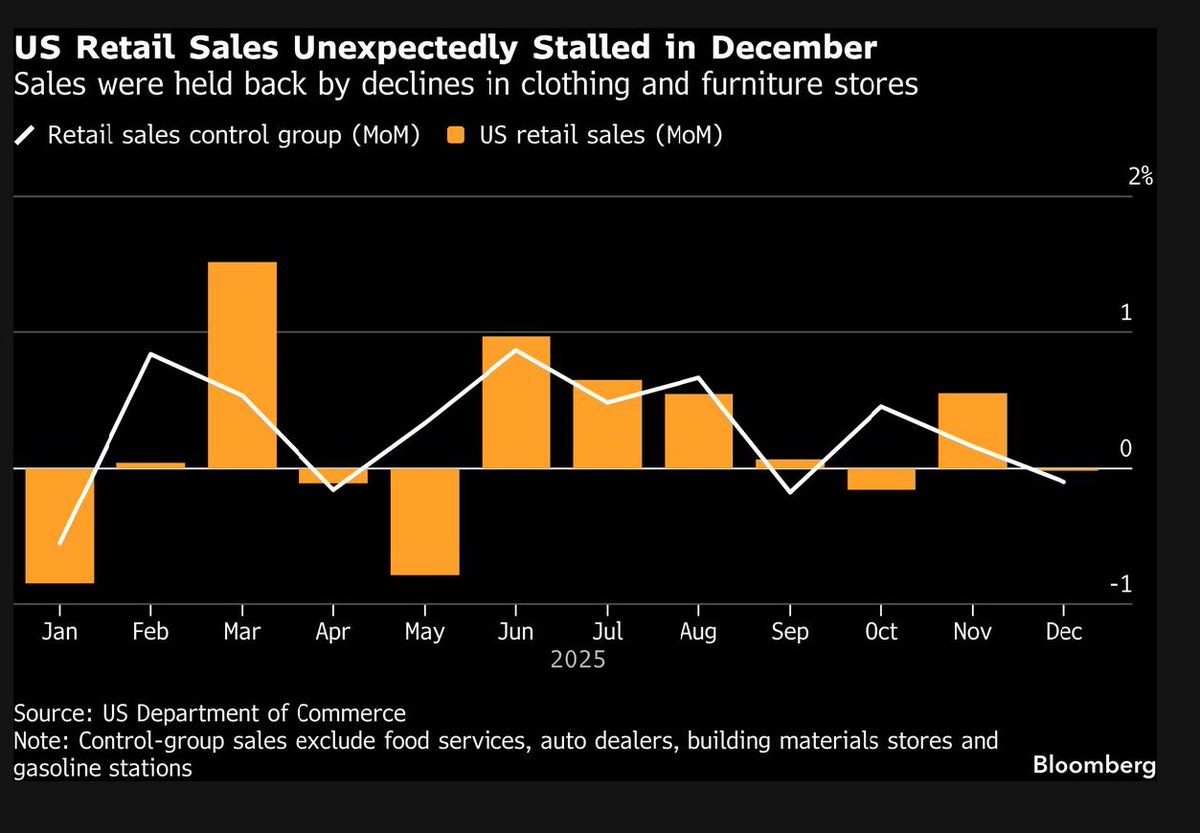
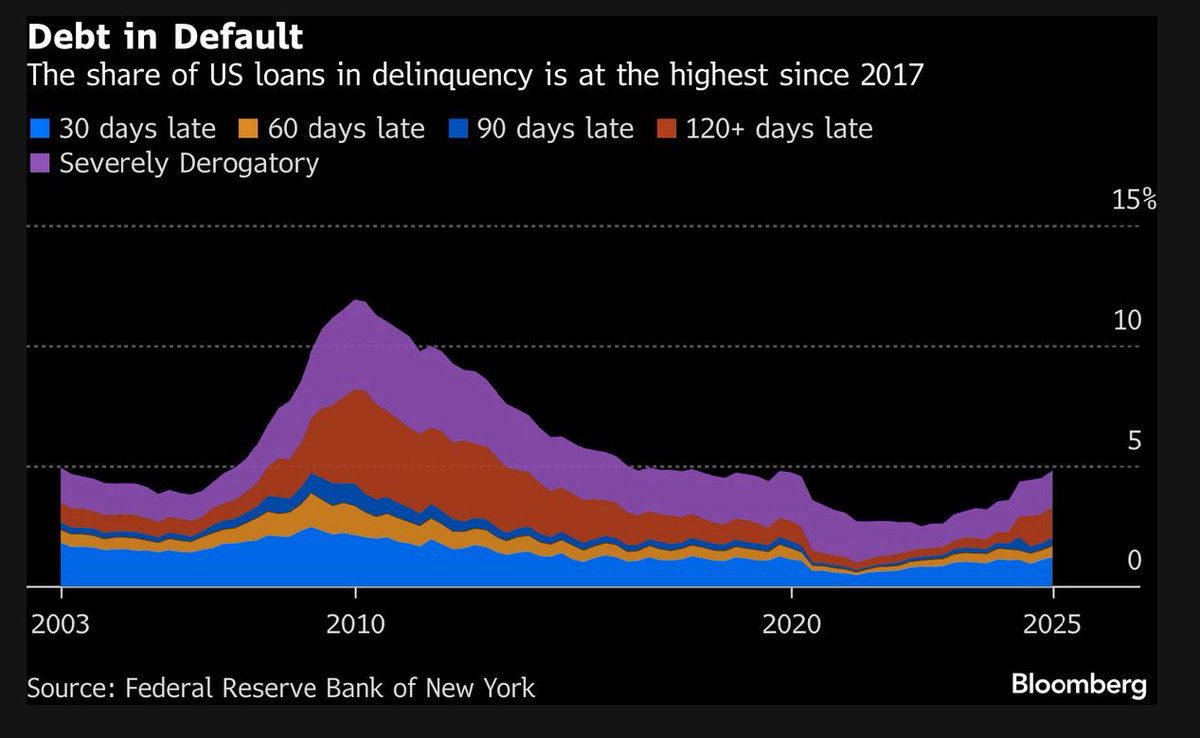
The one-two punch today of highly disappointing holiday retail sales and the highest consumer delinquencies since 2017 paints a bleak picture for lower-income and younger Americans. https://t.co/Bd2eX18BAU
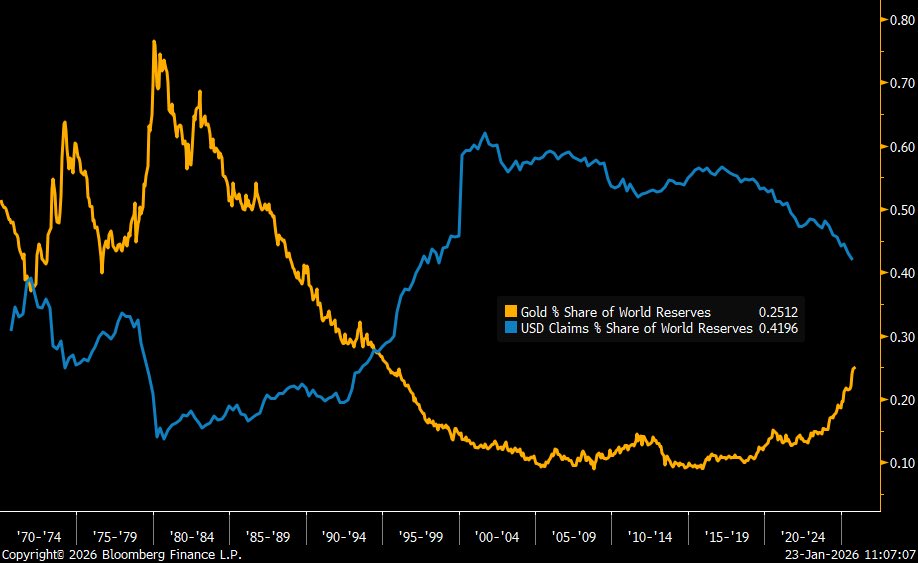
Gold now accounts for 25% of total world reserves. Still below the USD as a % share, and it remains far below its share in the 70s & 80s. In other words, if the recent reasons for buying gold persist, it can keep rising.
@Ritholtz@Ritholtz I enjoyed the section on Harvard's endowment in How Not To Invest (and many of the excellent lessons to be learned in the rest of the book, too!)
Is MLS standing for Messi League Soccer now? 🐐🔥
This chart shows expected goals (xG) + assists (xA) per 90 mins in 2025. Messi’s a total outlier—way up in the stars while everyone else is grinding in the grass. The #GOAT is turning the league into his playground! #Messi#Soccer
Fed cutting rates… while 10-year US Treasury holds flat near 4% vs. a year ago. 🕺🪑💸when will the music stop? S&P 500 +14%, $QQQ +23%, #Bitcoin +44%, $Gold +57% since last year #fintwit#stocks#Crypto
history doesn't repeat but it does rhyme "#Stablecoins may feel novel but... From 1863 to 1935, “national bank notes” circulated widely as a form of private money that was backed by public debt." AND "...no losses were ever incurred by holders of national bank notes" #crypto
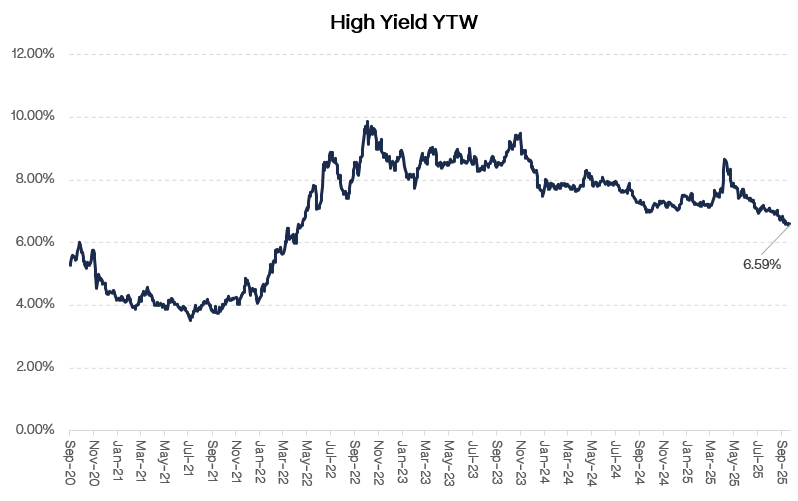
High yield "yields" sitting at 40-months lows...
$12bn of supply last week, busiest since early August...
CCCs back inside 10% YTW...
Nature is healing...
#USOpen mens draw is out🎾 long live the one-handed backhand 1st round Musetti v Mpetshi Perricard 🎾 2014 winner 🥇Cilic v Bublik 🎾🇺🇸's top seed Fritz must go through Djoko and Alcaraz 😰 #tennis