I manage my portfolio primarily through the lens of technical analysis— drawing lines on a chart. I write a weekly newsletter sharing market thoughts and ideas.
È arrivato anche il mio momento
Dopo circa 6 lunghi anni appendo anche io il joypad 🎮 o almeno per quest’ anno, poi chissà..
Saluto i miei ultimi compagni del @Nocerinaesport e tutti quelli con cui ho giocato almeno una volta
Spero in un arrivederci, è stato tutto molto bello
Wow. Largest inflow ever to S&P 500 ETF ever.
In past 72 hours I have observed the chart below, another showing record retail inflow, retail confidence at highs, progressing through a month of greed on the back of the best November since 1980. Breadth has been phenomenal relative to the last two years. Santa spirit is at all time highs. 🎅
Considering the above— it is likely everyone has felt some benefit from this past two month. Small caps remarkable outperformance saving many late index participants, bonds outperforming the S&P 500 from the October low, even the bitcoin crowd has sense of euphoria into year end.
Again— it feels like everyone is in the equity pool again, and much faster than the last time. The bull trade takes the win for the year, and certainly over the last two months.
A final overarching thought— this past summer (April-August) served as a friendly reminder that the market can operate in a state of greed for a long time, nearly half the year.
One more— the eventual fed pivot. I have to impression most participants will neglect the majority of history supporting the outcome where markets most often bottom after rates have pivoted, up into that pivot they run. That is speculated to be March with some opinions on either end of the consensus.
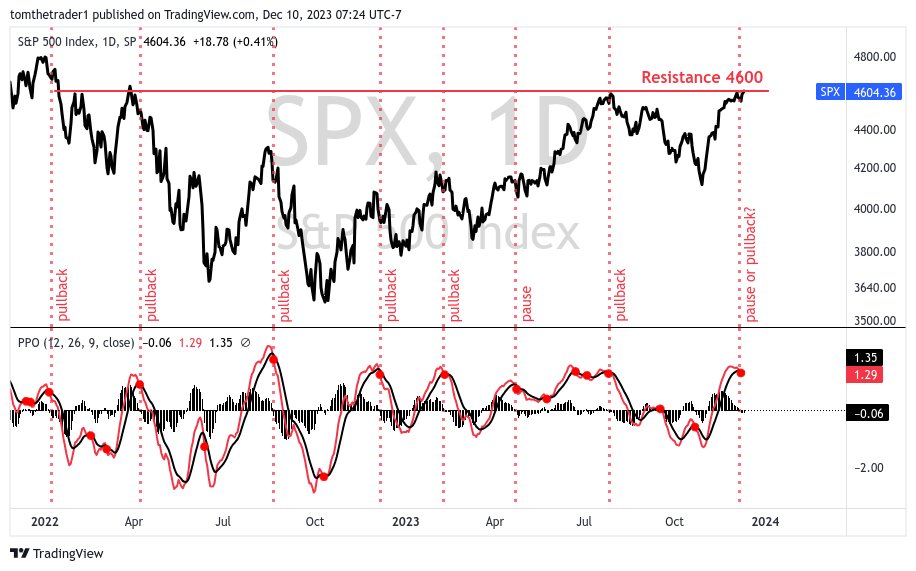
S&P 500 thoughts: Momentum reversed on a dime through last week with the index breaking above 4600 and hitting 2023 highs alongside the Nasdaq. The Dow Jones marked new all-time highs. Breadth is the best the market has seen over the last two years.
I'm cautious here. It has been well shared that retail participants have jumped in with both feet. The "Everyone Is In The Pool" feeling. Sentiment remains in greed, and most technical measures are stretched into key resistance zones.
The breakout last week quickly reversed the negative crossover in the Price Percentage Oscillator (lower panel). This oscillator offers insight into trend momentum. To add probability to a local top I am keeping watch for signs of momentum fatigue with successive negative crossovers / interruptions, this structure is what preceded the summer highs.
I lean towards the idea that the market remains poised for a healthy pullback. For me, a reasonable spot is the medium duration moving average, currently at 4490, a 4.8% decline from Friday's close. This key moving average acts as support during uptrend consolidation.
Sentiment: Greed
Backdrop: Best November since 1980
Consensus ahead: Santa rally
Charts: Extended in most technical measures
Fed: Cutting Rate Discussion
Retail: All-in 😳
This trade developed through the back half of the year. Snapchat briefly after this post had a failed breakout and rapidly traded below $10. A red open, but I still liked the idea and bought.
Most recently (ie. last 7 weeks) Snapchat joined the small cap outperformance. +84% from the October low.
While today’s 17 price is below the 21-26 target for me, this is a spot to secure profit.
S&P 500 thoughts: It was incorrect to be anything but bullish over the last 6-7 weeks. The entire summer correction has been wiped out like it never happened. As I think about the next two months I’m not excited about the prospects of staying bullish here. My own long participation during this rally has been a missed opportunity— the silver lining has been catching the outperformance in small caps.
For a second time this year— it feels like “everyone is in the pool” again, even faster than the last time.
The ARKK trade this morning has achieved the 52 target. 32% over the last four weeks. 🎯
For me, this marks a spot to take profit across the growth category. The next stage is the breakout trade. Like the broader market— this category is equally due for a healthy pause or pullback.
S&P 500 thoughts: Momentum is Fading (Yes, this is despite the index closing last week at fresh highs for the year).
In the lower panel of the chart is the Percentage Price Oscillator, which measures the % difference between two short term moving averages, providing insight into the momentum of the prevailing trend. That insight says momentum is fading.
The red dot annotations signal negative crossover events characterizing a slowdown in momentum. Over the past two years, these events have consistently signaled a pullback or pause. I do not imagine this time will be any different.
My analysis favors a healthy decline towards the medium duration moving average (50 day), currently at 4450 reflecting a modest 3.5% decline from Friday's close.
The market ended the chop up for the week, S&P 500 +0.2% and Nasdaq +0.5%. I exercised patience by electing to make no changes to my positioning. I've sustained my long exposure to a select group of growth names, equally hedged with a Nasdaq short.
I maintain the outlook that in the very near term the market is stretched and a healthy pullback is more probable than immediate continuation.
Expanded thoughts and charts will be updated on Sunday in longer form post and letter. Enjoy the weekend.
The performance of the S&P 500 has led to a negative crossover in the Percentage Price Oscillator. A pullback should accelerate as price trades below 4525. My analysis continues to favor a 3-5% correction. The index is down 1% through the week.
The S&P 500 is opening the week -1%, the Nasdaq nearly -2%! The oscillator is likely to signal a negative crossover today or tomorrow. The pause / pullback scenario is underway.
S&P 500 thoughts: Greed remains high while momentum is fading. With the index trading just below the visual 4600 resistance pivot, it appears ready for a healthy pause or pullback.
In the lower panel of the chart is the Percentage Price Oscillator. The oscillator measures the percent difference between two short duration moving averages, this is one way to technically gauge momentum of a trend.
The oscillator is also annotated with red dots signalling a negative crossover. Historically, since the 2022 market high these negative crossover events have reliably signaled an impending pullback or pause for the index. A shallow decline of 3 - 5% is a healthy fit in my analysis.
My read on the S&P 500 through November was flawed. Concluding a successful short sided trade at the end of October I entered November anticipating an opportunity to accumulate long exposure. The market did not wait for me.
On a positive note, I shared speculation that as market breadth improved outperformance could come from ARKK and the '2020-growth' cohort. (Unity, Paypal, Snapchat, Ayden, and Figs being names I shared here on X). This long exposure well outperformed both the S&P 500 and Nasdaq in November.
Closing December 1 I have hedged this category outperformance with a Nasdaq (QQQ) short. Krampus Pullback before Santa Rally.
Expanded thoughts and charts will be updated tomorrow in the longer form post and Sunday letter. Enjoy the weekend.
The ARKK trades continues very well.
ARKK +21.3%
SPY +4.3%
QQQ +3.4%
I wrote "In the scenario where market breadth improves and supports a continued rally in the indices I think then the remaining "2020 growth" cohort outperforms."
This speculation is playing out well.
The S&P 500 has remained mostly flat through Thursday, sentiment is in the same greed zone (CNN Fear & Greed Index) and active fund managers have continued to increase exposure (NAAIM Index reading 81, the highest reading since August). This combination of elevated exposure and greed has preceded meaningful turning points in the market.
My analysis continues to favor the scenario where the index progresses through a healthy moderate pullback of 3-5%.