My new paper came out in the Journal of Marketing Analytics! Check out the summary here or click through for the full article
https://t.co/M9OMeiE1EP #EconTwitter#Marketing#Twitter#Retail
Some great charts on global electric car sales in the latest from @_HannahRitchie (link next). She flags the massive differences in adoption rates across countries.
Global sales of combustion engine cars peaked in 2017—
To decarbonize road transport, the world must move away from petrol and diesel cars towards electric vehicles and other forms of low-carbon transport.
This transition has already started. In fact, global sales of combustion engine cars are well past their peak and are now falling.
As you can see in the chart, global sales peaked in 2017. This is calculated based on data from the International Energy Agency. Bloomberg New Energy Finance also estimated this peak occurred around that time.
Sales of electric cars, on the other hand, are growing quickly. They more than doubled in the three years from 2022 to 2025.
(This Data Insight was written by @_HannahRitchie.)
Is AI the next wheel, electricity or internet?
Here’s what makes artificial intelligence such a game changer, both economically and technologically.
#ConvenienceWeekly#cstores#AI@TomWeinandy@upside
🎧More here: https://t.co/lyMg9inUv2
Behavior change continues both inside the convenience store and at the pump. Just because gas prices are inelastic doesn't mean consumers don't change their habits.
https://t.co/rwPJeuyFWs
My latest research is now live in Upside's new report about the "Loyalty Plateau". It turns out most loyalty members belong to MANY other loyalty programs, spreading out their spend and reducing the program's impact for retailers.
https://t.co/imy2f9E715
1/ New piece out with the incredible @econJaredB. We dig into what's been on everybody's mind — affordability, consumer sentiment, and whether we've cracked the mystery of the vibes puzzle: https://t.co/P1OmJt8SBy
Taxi vs. Uber/Lyft drivers respond very differently to high gas prices.
Rideshare drivers can log off when costs spike. Taxi drivers lease shifts—so once they’re on, they drive no matter the price. Same job, totally different incentives.
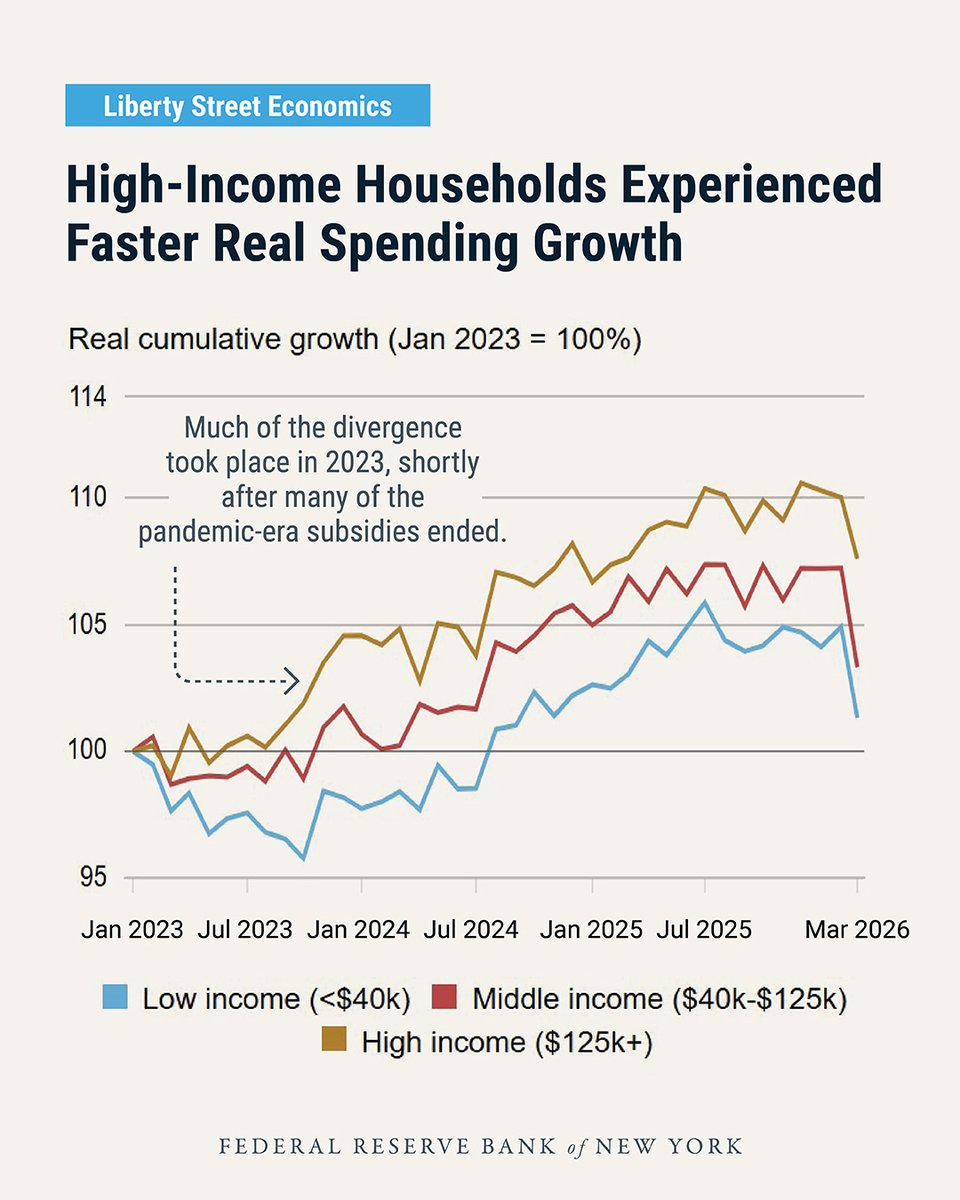
Aggregate real consumer spending has risen solidly since 2023. Who’s driving spending in this K-shaped economy? In this post, the first in a two-part series, the authors find that that high-income households haven driven retail spending growth, while low- and middle-income households experienced extended periods of stalled or declining spending growth. https://t.co/OEDV4VEXVr
Despite the spike in gas prices, U.S. households still aren't driving that much less. I had a great conversation with the FT about the many other ways consumers are shifting behavior due to fuel prices, even as miles driven have gone up since February.
https://t.co/pPJ9EMjkoo
Oil’s off April highs, but gas prices haven’t followed. Why? Seasonal forces: higher summer driving demand + pricier summer-blend fuel. Some relief: prices dipped below $4 last week, but real relief likely needs full Strait of Hormuz reopening.
@bencasselman Agreed. Per Gelman et al. (2017), it takes 4-12 weeks. But given how inelastic fuel is in the short run, the pass through is 80-100% 😬
https://t.co/xdwhFN8EKv
My March Fuel Trends recap is live: 20K+ U.S. stations/c-stores, full view of Iran-war price impacts, and a key consumer shift—transactions are up, but premium/midgrade buyers are trading down to regular. https://t.co/cqc9ntWaaC
It's all retailers, not just gas stations, affected by rising gas prices. When gas prices increase, customers make up 80-100% of that lost money by cutting back in non-fuel discretionary spending.
Gas prices are high—but likely still lower than a pure supply shock would imply. Why? Markets are pricing in a relatively short war and eventual supply recovery. If that changes, gas could climb a lot more. Video for the breakdown.
📊 Data update: Californians now travel nearly 10 million kilometers each month in driverless taxis—
In December 2024, passengers in California's driverless taxis were traveling around 3.8 million kilometers per month.
By the end of 2025, that figure had climbed to roughly 9.4 million — more than doubling in a single year. You can see this increase in the chart.
This data comes from the California Public Utilities Commission (CPUC), which requires companies operating paid driverless taxi services to file detailed quarterly reports on passenger distance, safety incidents, and other operational data. (Only Waymo has been in operation since late 2023.)
The reports are published on the CPUC's website, making it possible to track this fast-moving industry with publicly available, standardized data.
Our colleague Veronika Samborska recently updated this chart with the CPUC's latest quarterly report and will continue to do so each time they publish one.
High gas prices can squeeze food budgets, but so far we’re not seeing a big pullback in spending. Upside data show c-store demand dipped briefly, then rebounded. The bigger risk may be ahead: higher fuel and fertilizer costs could pressure prices and retailers.