We can officially say goodbye to CME gaps for $BTC starting May 29th.
A strategy that delivered a 98% fill rate over the past 3 years will now be removed.
Expect weekend algos to adapt, the game is changing.
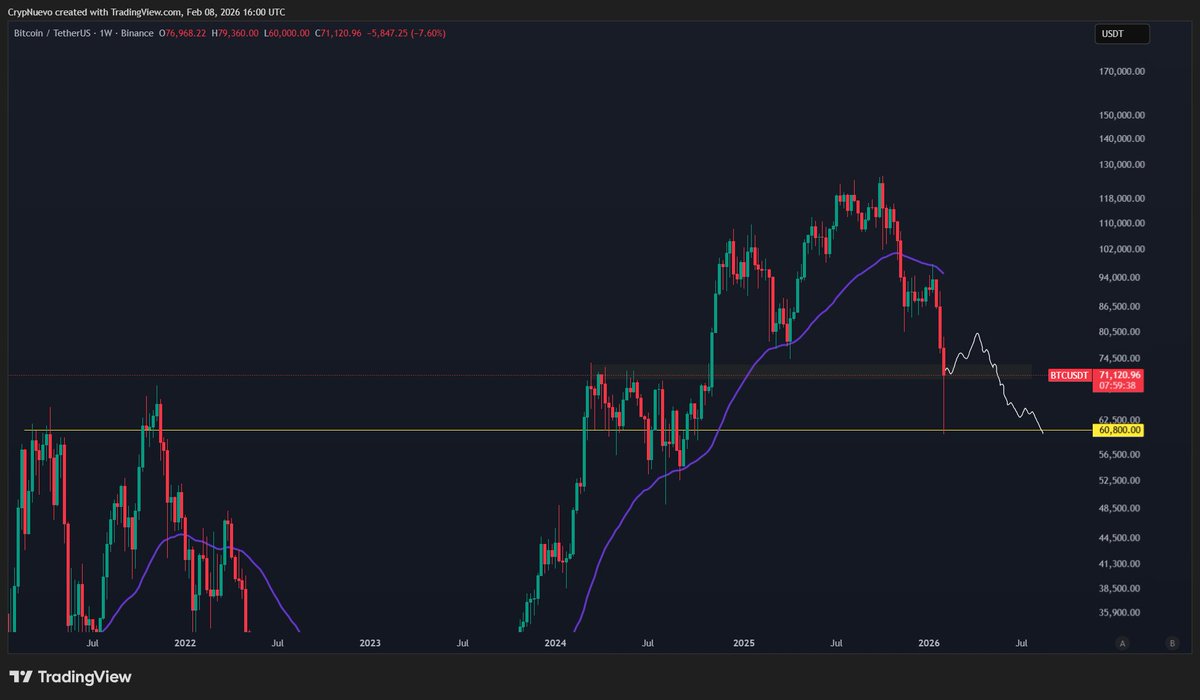
I predicted the top, now its time to predict the bottom.
Based on diminishing returns/retracements & fractal analysis, I believe this time we wont bottom where most expect.
I expect $BTC to bottom in August. You heard it here first.
$BTC Sunday update:
According to the wick fill strategy, this new 1W long wick will likely get filled.
Perhaps we could see a bit of upside continuation with this short-term bounce - if so, I'll use it to open shorts towards the wick.
And we'll likely form a range.
🧵↓(1/4)
*#BTC just dropped below the April 2025 low.*
If it does not bounce soon, this is going to be one hell of a midterm year.
If it can bounce, it gives us a few months and gets us closer to October without so much bad price action (likely the bottom in time).
I feel like the bear narrative has been really strong for a while, and so I would expect a countertrend rally soon so that it gives the bulls some hope for a while.
However, I have learned my lesson in prior cycles, so I do not attempt to trade them. Countertrend rallies can happen, but sometimes they happen when you least expect them, not when everyone expects them.
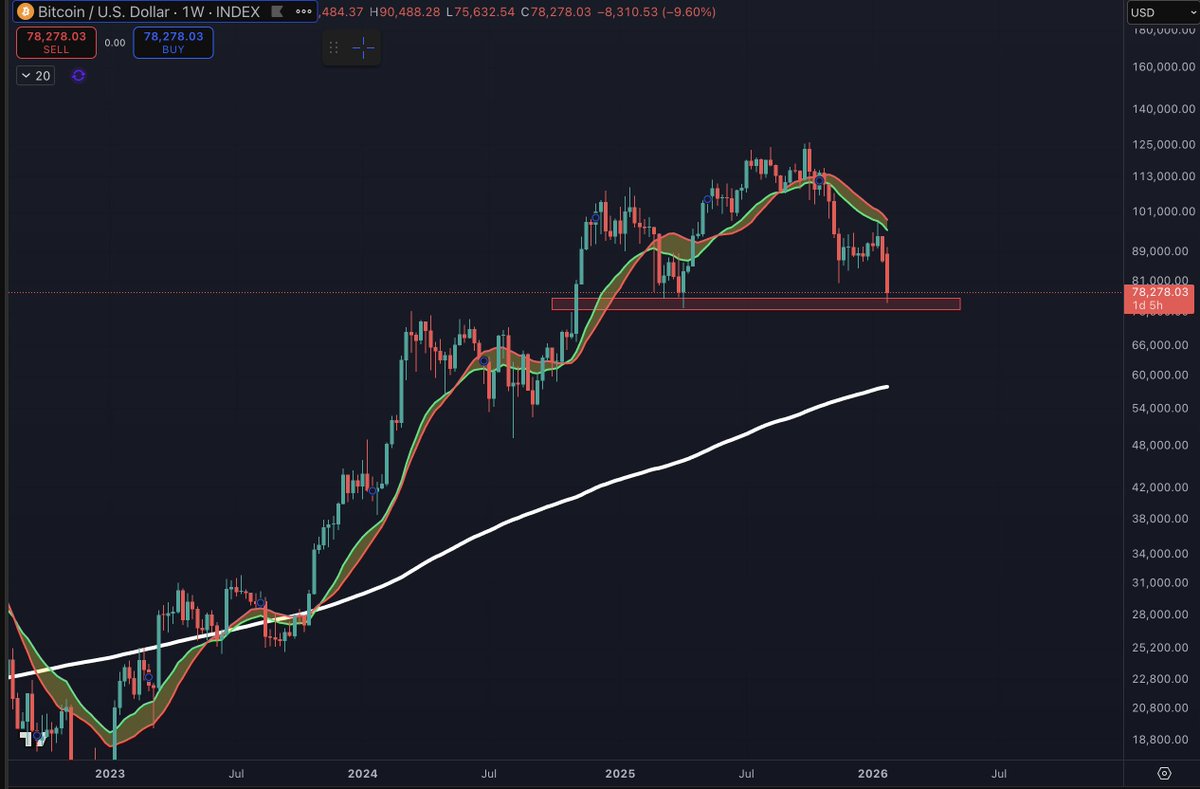
It makes sense to assume that a sweep of a prior low would offer some relief, as that has been true for BTC even during the bull market.
But in 2014/2018/2022 when BTC fell below the 100W SMA, it was straight to the 200W SMA before any relief occurred.
The time to sell BTC was late last year, not panicking on dumps in the midterm year.
I just try and focus on the bigger picture and the bigger picture is that late Q3/early Q4 will be a better time to move real money back into the market.
Between now and then it is just people trying to make money during difficult times by trying to trade support/resistance levels.
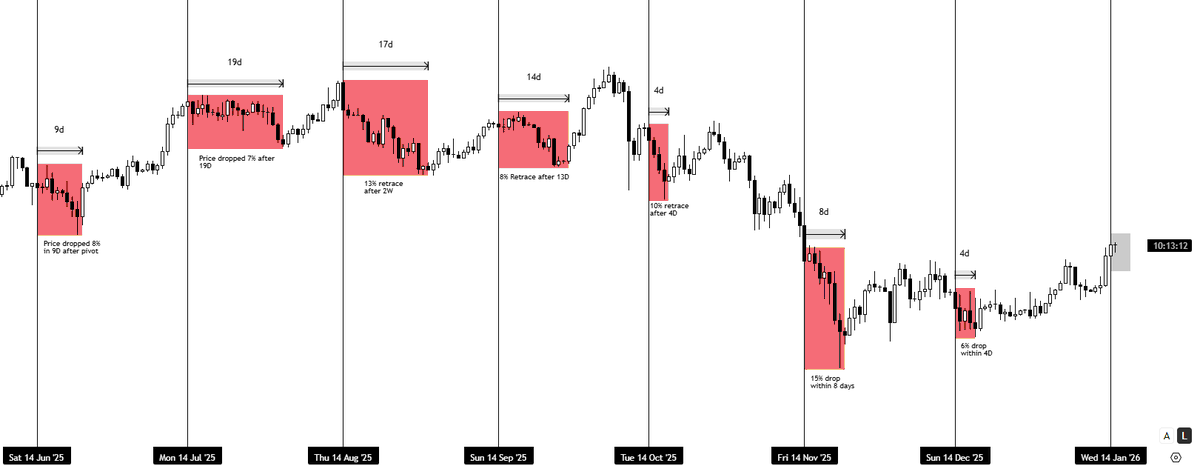
Mark your calendars, the 14th.
$BTC has nuked after the pivot 8/8 times, with at least a 4% drop every time. However...
If price pushes down into the pivot, I’ll be looking for a long instead of betting on more downside. We will have to see how price action forms...
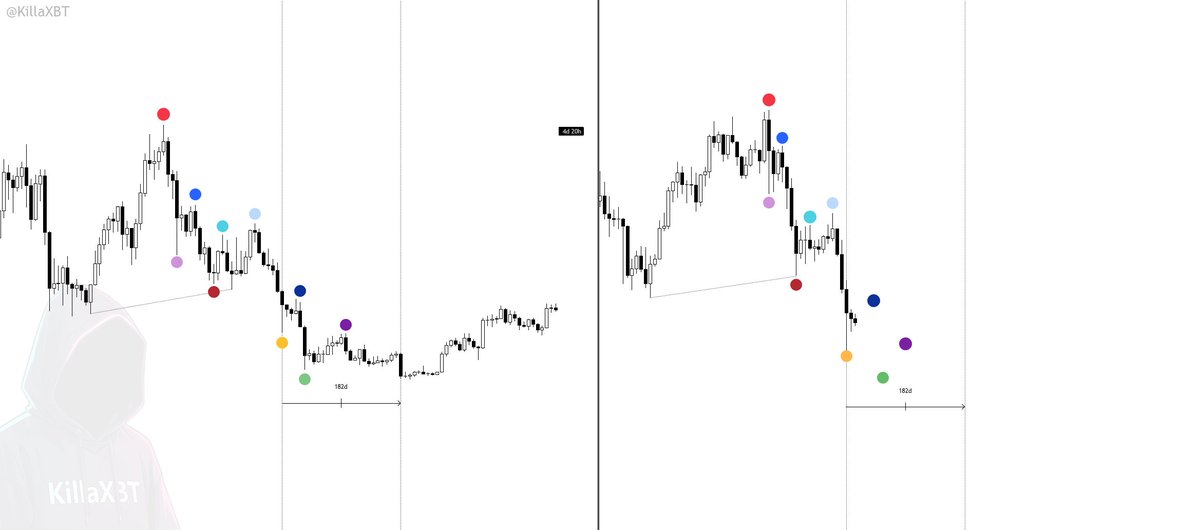
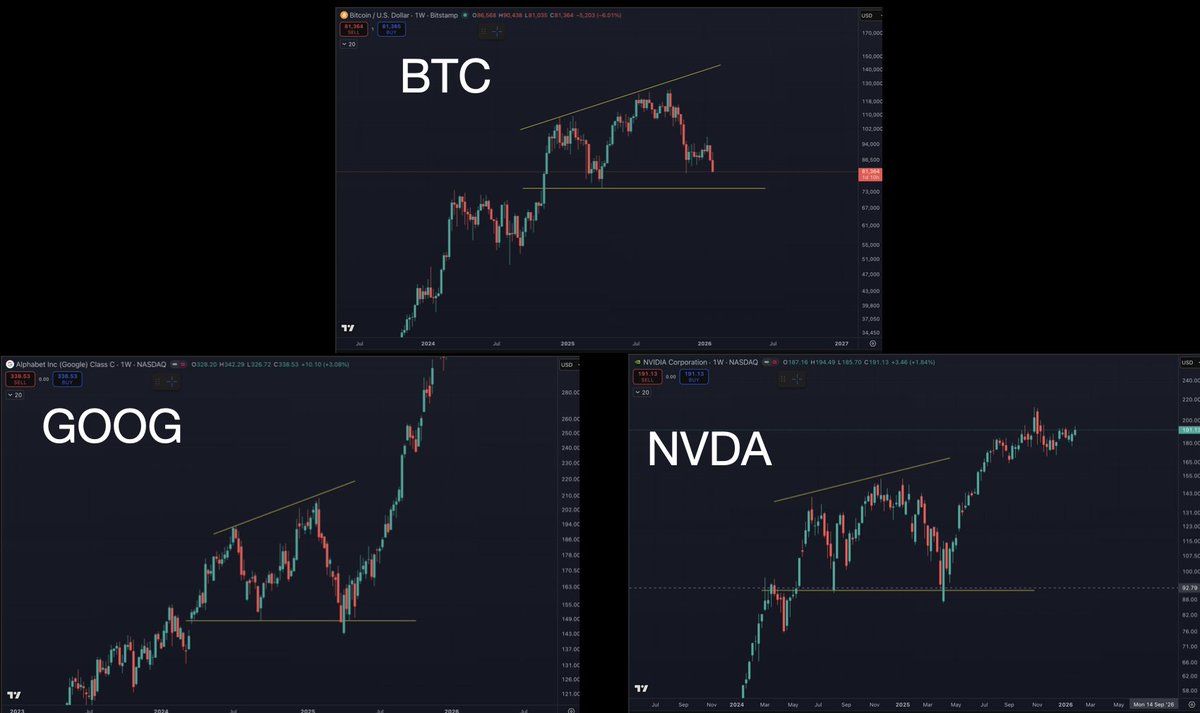
This is the bull case for Bitcoin by the way.
If Bitcoin sweeps the low, the pattern would look a lot like prior patterns by GOOG and NVDA.
I would assume that the rally would not result in a new all time high, but a macro lower high, before going to the 200W SMA.
“There’s always a bull market somewhere”
That bull market might be starting in DXY for a while, probably one of the most hated things right now.
I think it would be wise to have some cash ready for some good buys on risk assets late Q3/early Q4
With metals dropping, stocks likely follow.
Btc in a typical 4 year cycle bear market too.
Dare I say it, are we going back to “cash is king?”
I rarely post $SPX charts, but I spotted a pattern nearly identical to 2025’s corrective move.
If it unfolds the same way, it could signal that S&P 500 is on the brink of a sharp drop.
For clarity, I’m not short on it & will never short this asset.
$BTC
You guys already know about my 14th pivot and what typically follows, now here’s the next one.
January 28th.
For 8 consecutive months, we’ve seen a consistent negative reaction. BTC usually experiences an average pullback of 5–6%, sometimes more.
Historically, after the 14th, BTC has dropped an average of 5–8%. We’re already down about 4% from the highs, which aligns with that data. The next key area where a negative reaction is likely is around January 28th.
I’ve been trading this recurring pattern for the past five months and will continue to do so until it’s invalidated.
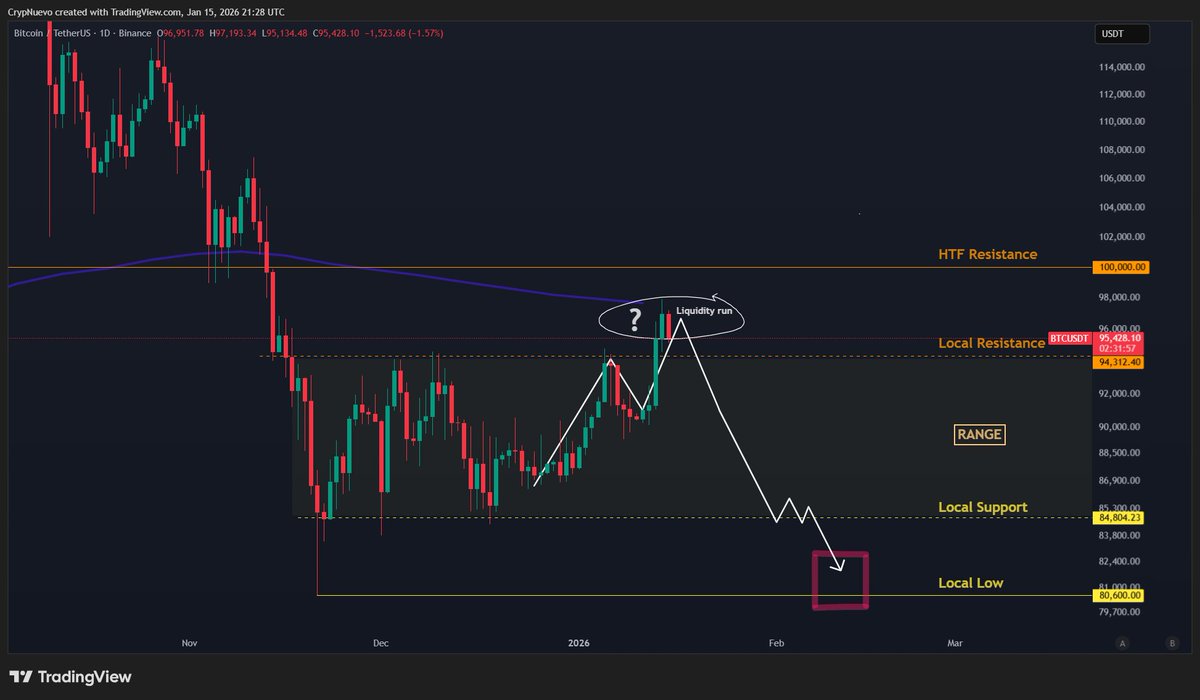
$BTC
Huge stack of long liquidity positioned around the 2025 Yearly Open (93.6K)
Quite the important area to observe like I mentioned a few times. Bulls do not want to lose that area otherwise sub 90K comes quickly.
Hold = shorts above 97-99K next.
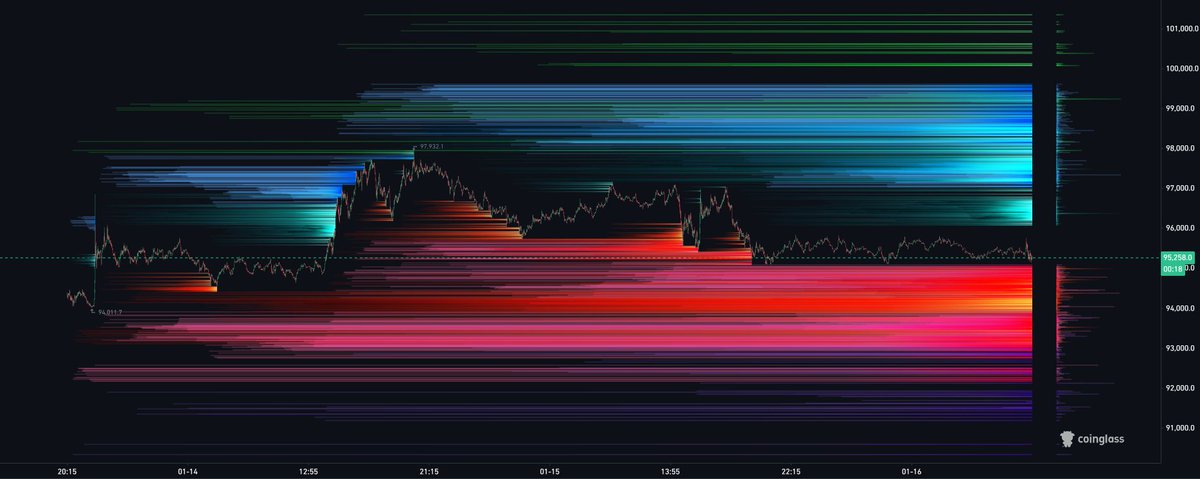
$BTC update:
It would be funny if this continued to play out...
This could be a liquidity run to the 1W50EMA HTF resistance. The short liquidations we pointed at $96k have been hit.
•Confirmation is dropping back below $94.5k (range).
•Invalidation is acceptance above $100k.
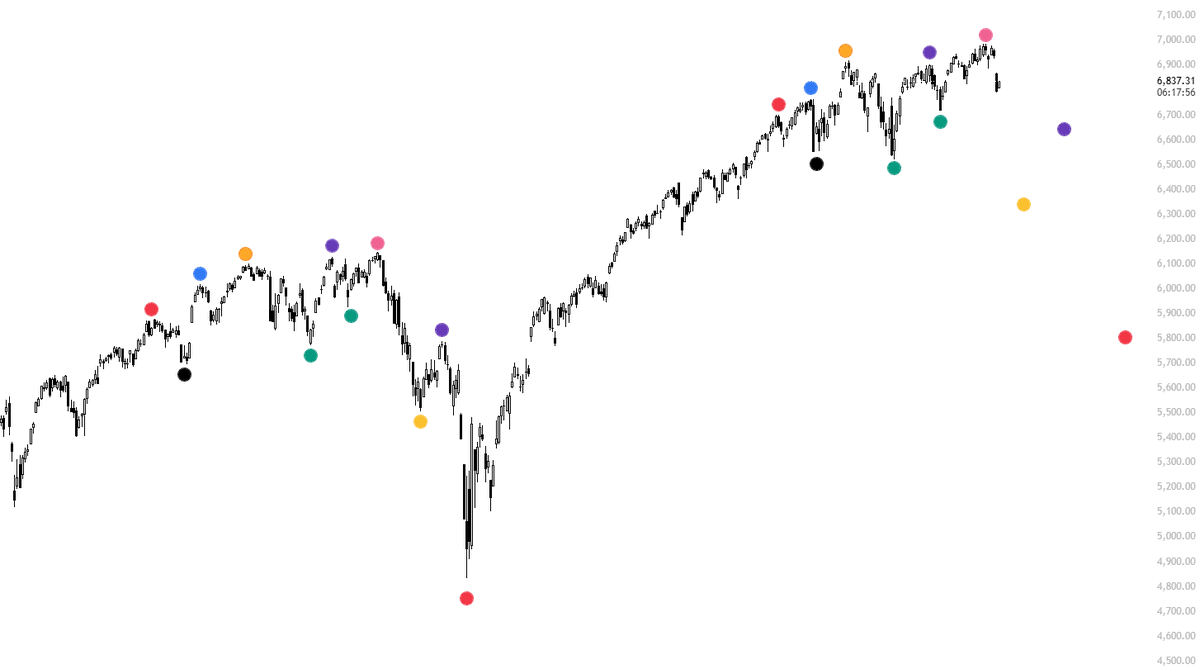
$BTC | I haven’t forgotten about my 14th Pivot.
Over the prior 7 months, the average drop within two weeks after the 14th is ~8%, making it statistically likely we see a similar move again if the pattern continues.
Like any pattern, it can always be invalidated, but I’ve positioned using this setup 4 out of 4 times and capitalized on every occurrence. That’s why it remains a key component of my short thesis as well.
If we’re on the verge of an impulsive move to a new ATH (which would imply a historic decoupling) then this thesis is invalidated. While LTF structure has technically shifted after breaking out of the 4W range, the overall HTF structure remains bearish. Given that, I think it’s still relevant to highlight this pattern that’s persisted for more than half a year.
Will we see the same thing develop?
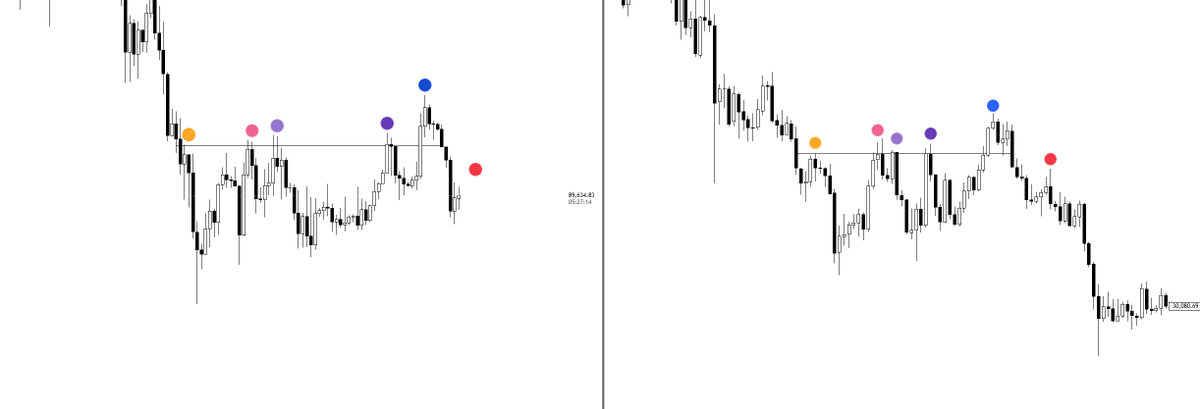
$BTC update:
We've been able to successfully project the exact Price Action for the last 7 days.
Now, I call for caution. This could be a liquidity run towards the 1W50EMA where price could be rejected from.
Breaking above $100k (4% higher) is my invalidation to this idea.