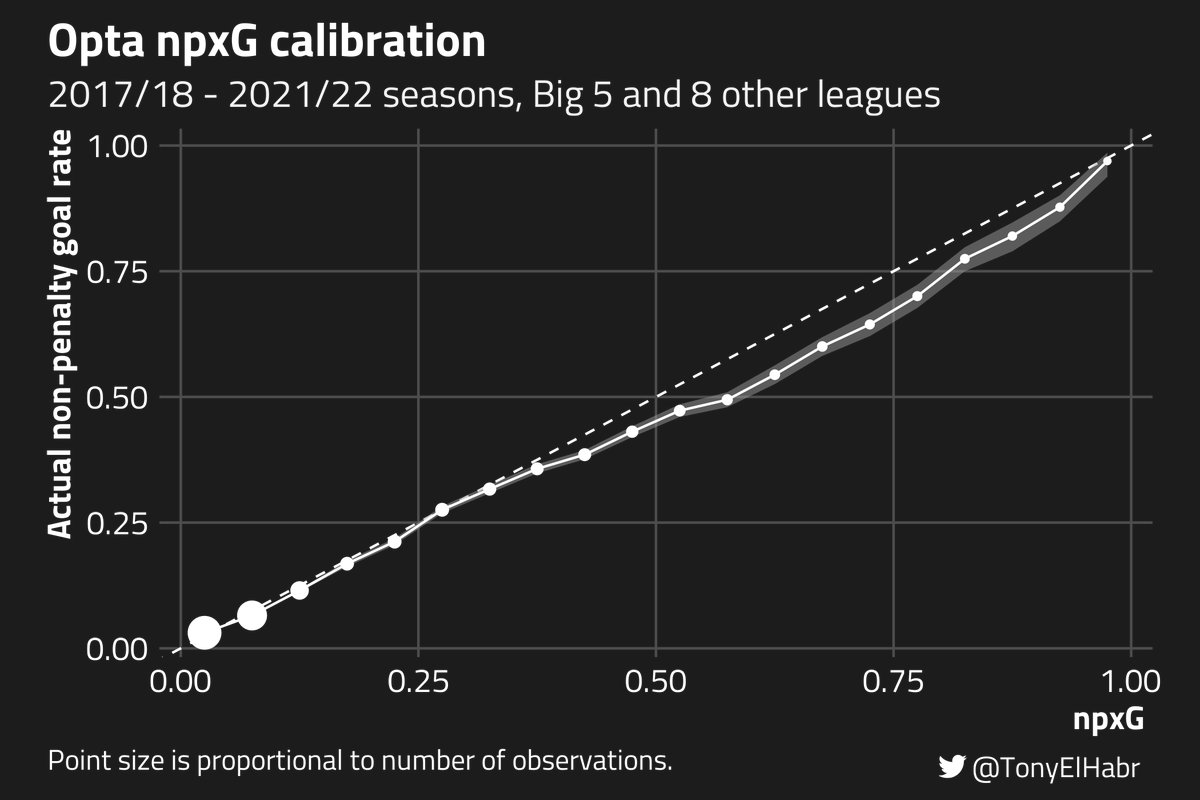
I've recently finished my dissertation, building on an idea that @Torvaney explained at the last Statsbomb Conference. I'd be super interested in any thoughts!
https://t.co/5FKkSHpqaV
Introducing... SCOUTED 001
This is our brand-new and best-ever print publication, funded by you, created by us, starring Enzo Fernández. Backing our limited-time crowdfunding campaign is the only way to guarantee your copy. Back it now!
▶️ https://t.co/V8X0R6tTtw
This package makes 200+ metrics available for players/teams at match and season levels.
Even better: Do you use something other than R for analysis? You can download the scraped data here: https://t.co/Ygx6eUJycs. Data will update several times a week once the season starts.
🚨 New R package alert! 🚨
I’m over the moon to share that nwslR is back and better than before. The goal is to make #NWSL stats and information accessible to fans and analysts of the league.
Check it out: https://t.co/Q0kAEJq35w
Aviva is matching personal donations to Bow Food Bank (up to £250 per person).
The food bank buys most of the food they give out at wholesale prices, and most of the money they raise goes on food, so anything you can give will go far!
https://t.co/CEzK39uhWM
Aviva is matching personal donations to Bow Food Bank (up to £250 per person).
The food bank buys most of the food they give out at wholesale prices, and most of the money they raise goes on food, so anything you can give will go far!
https://t.co/CEzK39uhWM
@NathanAClark I think the only way out is modelling of one form or another.
For example, if youy modelled the above DAG to try and estimate the "true xG" (lol), I guess you'd end up with something like down-weighting observed xG according to the P(goal) and P(ruled out | goal)?