Look, most traders get wiped out because they only look at price charts. But the real story is in who's sitting on what side of the leverage game. Your dashboard helps them see ahead.
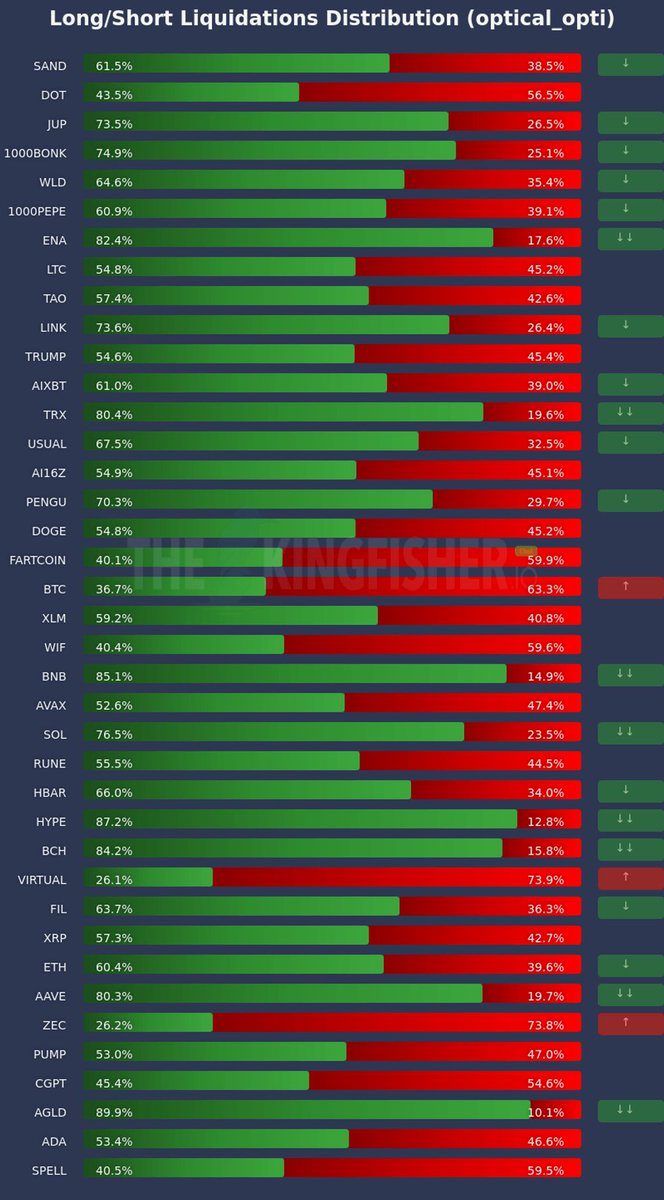
Long/Short Liquidations Distribution (optical_opti)
$BTC is screaming at us right now. You see that 63.3% short liquidation distribution? That's huge. A lot of people are betting against it, and if it moves up, those shorts are fuel.
And then there's $ZEC, with 73.8% short liqs. That's a ticking time bomb for anyone shorting it.
On the other hand, you have tokens like $ENA, $TRX, and $AGLD with over 80% long liquidations. That means the slightest dip can cascade into a lot of pain for over-leveraged longs.
This isn't about predicting the future. It's about understanding market structure. Where are the weak hands? Where is the liquidity trapped? That's what moves the market. Pay attention to these ratios. They tell you where the action is likely to be.
$10B HYPERUNIT WHALE MOVES $100M INTO BINANCE
The Hyperunit whale who made $200M shorting BTC has moved $129M of collateral into Binance. There has been speculation that he is continuing to short on Binance.
He still holds approximately $300M of USDC on-chain, as well as $5B of BTC and $5B ETH (staked)