Triangles are statistically the most reliable chart pattern in forex.
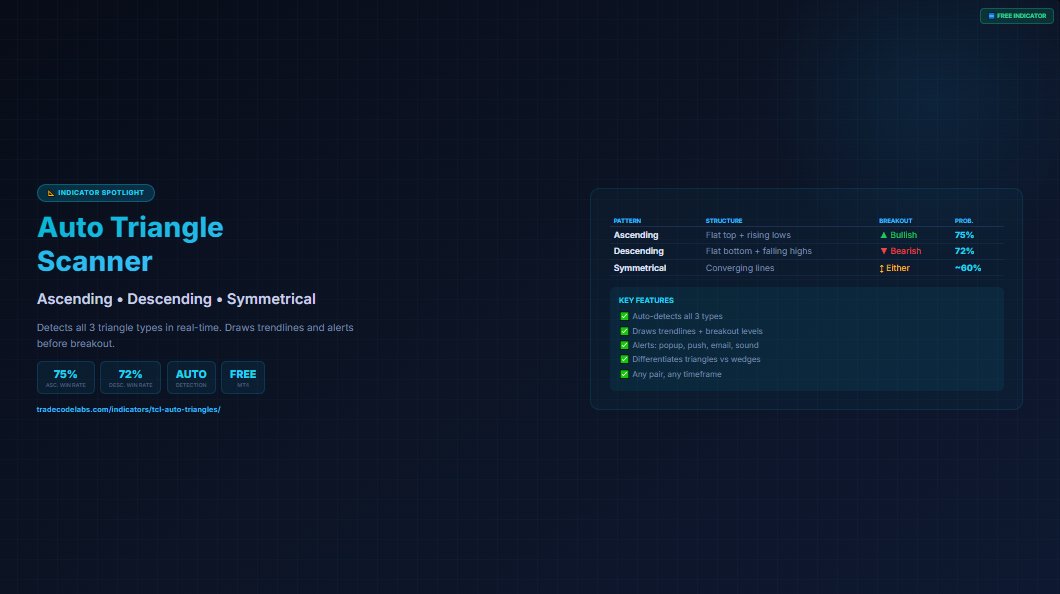
Ascending triangles break up 75% of the time. Descending break down 72%.
But most traders miss them because they're hard to spot in real-time.
Here's how to fix that 🧵
Common mistakes:
❌ Confusing wedges with triangles (different pattern, different strategy) ❌ Entering on the first trendline touch (wait for the breakout candle) ❌ Only watching one pair (triangles form everywhere, you need to scan)
Tweet 5: The fix: automate the scanning.
TCL Auto Triangles detects all 3 types in real-time: • Draws the trendlines for you • Marks the breakout level • Sends alerts BEFORE the breakout • Differentiates triangles from wedges
100% free. Works on any pair/timeframe.
Before algorithms existed, floor traders at the Chicago Mercantile Exchange used ONE calculation to navigate each day.
It's still embedded in institutional algos today.
Pivot Points — the indicator most retail traders ignore 🧵
What most traders don't know: there are 4 different pivot formulas.
• Classic — standard floor trader math • Fibonacci — uses 38.2%/61.8% for S/R • Woodie — weights the close heavier • Camarilla — tighter levels, built for scalping range fades
Each gives slightly different levels. Camarilla is the hidden gem.
TCL Power Meter does this automatically.
Dashboard on your chart showing all 8 currencies scored 0-100. Color coded. Updated in real-time.
100% free. Non-repainting.
https://t.co/XpE5jpEJPc
Drop your strongest/weakest currency below 👇
#Forex#CurrencyStrength#FX#Trading #ForexTrading #TechnicalAnalysis #MT4 #FreeIndicator #TradeCodeLabs #TradingTips
Friday challenge for my forex traders:
Without looking at any pair chart — which is the strongest currency right now? Which is the weakest?
If you can't answer instantly, you're trading blind.
Here's how to fix that 🧵
The math behind it:
For each currency, scan all 7 cross-pairs. Calculate RSI on each cross. Average the results.
One number tells you the aggregate momentum of that currency against the entire market.
No guessing. No bias. Just math.
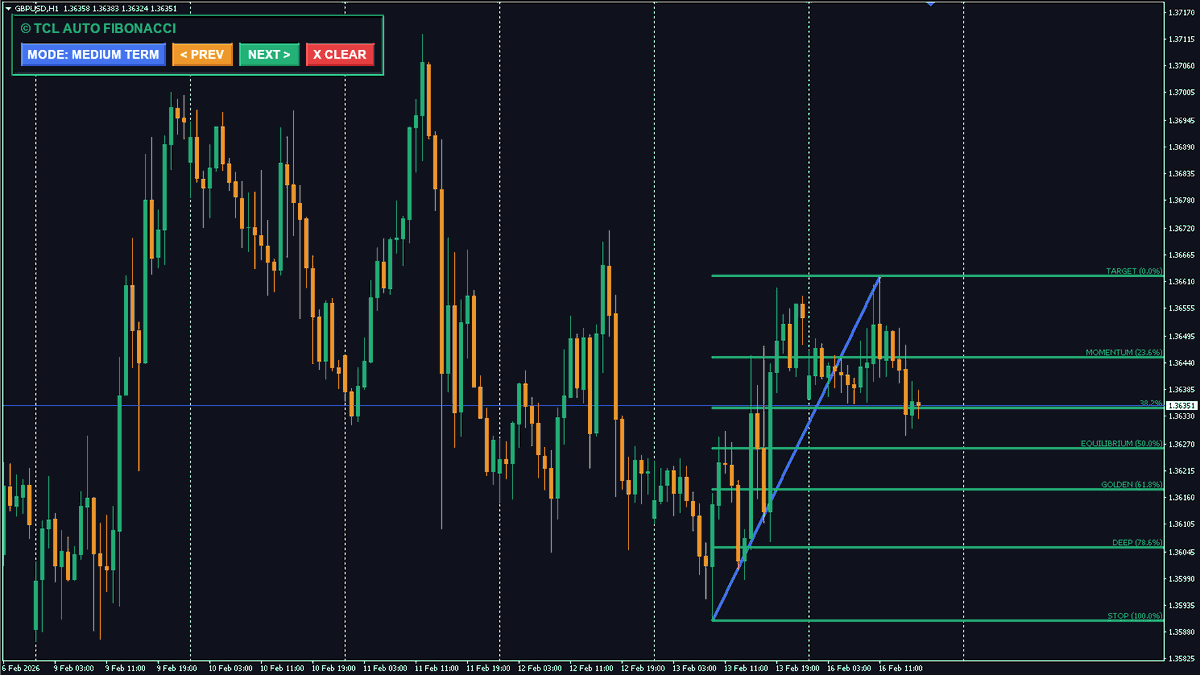
TCL Auto Fibonacci automates all of this:
✅ Auto-draws from significant swing points ✅ 3 modes (Short/Medium/Long Term) ✅ ADX filter — only draws when trending ✅ History navigation — scroll through past swings for backtesting ✅ Retracements + Extensions
https://t.co/JFh7HqNesX
#Forex #Fibonacci #TechnicalAnalysis #MT4 #ForexTrading #DayTrading #SwingTrading #GoldenRatio #PriceAction #TradeCodeLabs #TradingTips
The 61.8% Fibonacci level isn't magic.
It works because institutional algorithms are programmed to buy in the 50%-61.8% "discount zone."
When enough money watches the same level, it becomes a self-fulfilling prophecy.
Here's how to actually trade it 🧵
Quick tip: use different Fibonacci depths for different styles.
Scalping (M1-M5): Depth 12 — captures micro-pullbacks Day trading (M15-H1): Depth 36 — the main session move Swing trading (H4-D1): Depth 144 — major structural levels
Match your Fibonacci to your trading timeframe.