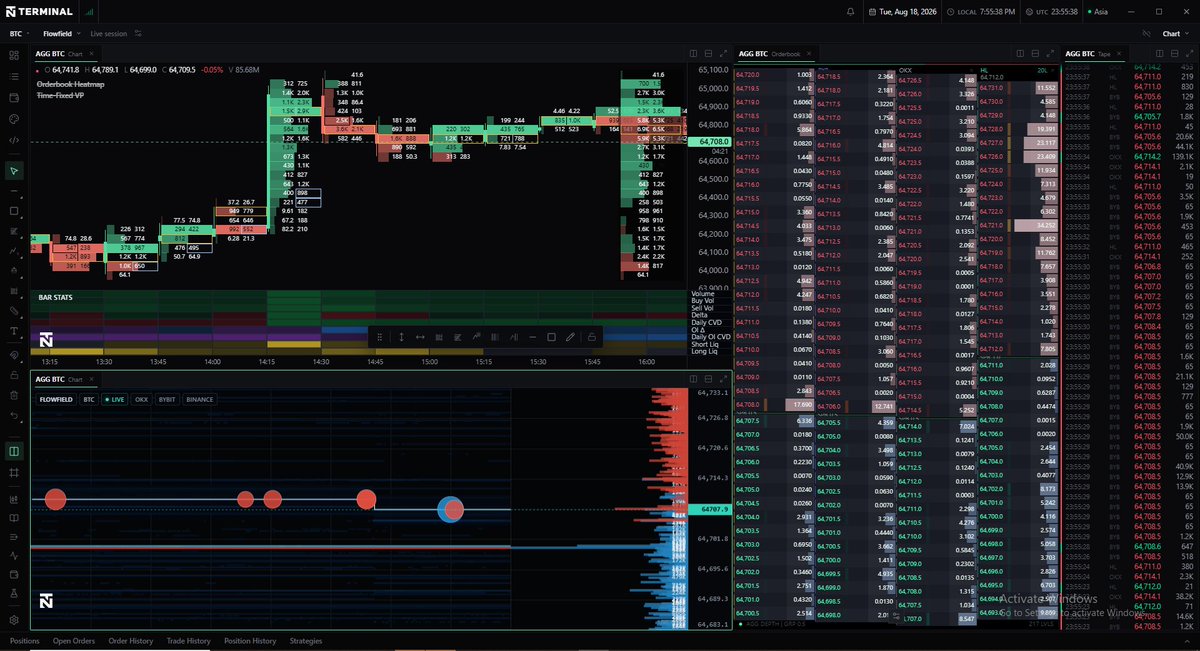
Three views. One live market.
Flowfield: tick-by-tick price and liquidity.
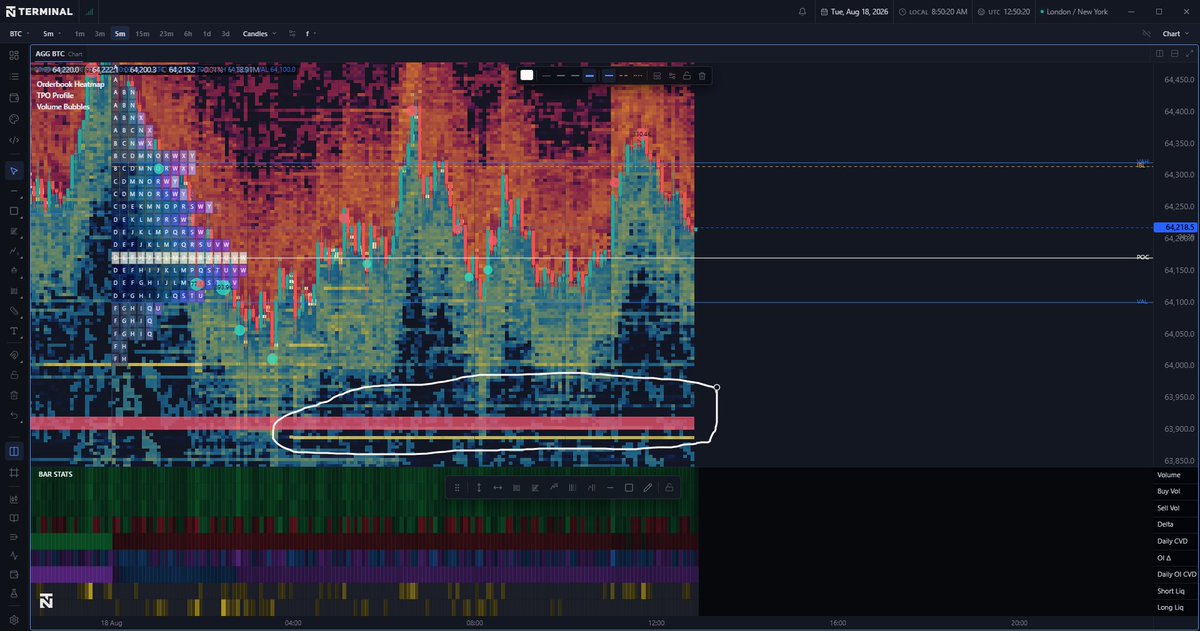
1-minute heatmap: structure developing through time.
Aggregated DOM: current depth across every venue.
Microstructure, context and live liquidity in one synchronized workspace.
https://t.co/jUc2H4uVwM
2,362 lines of code built around one objective: understanding the flow behind the move.
Heatmap. Footprint. Tape. OI. Liquidations.
Then a massive sweep runs the heatmap highs and the algo marks the top.
This is what becomes possible when your terminal sees more than candles.
🚨Latest TradeNet Beta Update📷
- Added HYPE and expanded Hyperliquid support across charts and market data. It is still being optimized and may have some rough edges.
- Introduced Flowfield, a Bookmap-style live chart with liquidity heatmaps, trade bubbles, aggregated order books, and second-based candles.
-Upgraded OB and liquidation heatmaps to be faster using low-cost integer data types, with improved live updates and fewer missing or duplicated sections.
- Added a new static candle backend that improves loading speed, caching, and consistency between live and historical candles.
- Improved footprint, VAP, volume profiles, bar statistics, OI, Delta, CVD, and liquidation data.
- Numerous fixes for disappearing data, candle gaps, request duplication, memory usage, WebSocket reconnects, and Lua indicators.
- Improved feature parity between the desktop and web terminals
Three views. One live market.
Flowfield: tick-by-tick price and liquidity.
1-minute heatmap: structure developing through time.
Aggregated DOM: current depth across every venue.
Microstructure, context and live liquidity in one synchronized workspace.
https://t.co/jUc2H4uVwM
@mmmatt That’s why I built it the way I did.
Our infrastructure took 9 months of 12-hour days to perfect.
We give users every piece of data, and it’s up to them to do what they wish with it.
Data and knowledge should be accessible. We’re making it a reality.