My Trading career in a nutshell:
1. Cleared JEE Mains. Couldn’t clear Advanced.
2. Got into a good college.
3. Started my own startup during college.
4. Began sharing charts on TradingView and grew into a widely followed author.
5. Placement season arrived. Cracked two companies and joined a trading firm.
6. Learned about bond markets, energy products, STIRs, Euribor, SONIA and curve trading.
7. Started a YouTube channel. Crossed 10,000 subscribers.
8. Left the firm to trade independently.
9. Became a full-time swing trader in Indian equities.
10. Trading got tough. Kept working on one strategy, studying, practising and refining it.
11. Started taking the gym and meditation seriously.
12. Became increasingly interested in trading psychology.
13. Started writing down my thoughts. Those thoughts became my first book.
14. Learned publishing from scratch, hired professional editors and printers, and published “Trading Is an Emotion.”
15. Passed the NISM exam and applied for SEBI Research Analyst registration.
16. After 6–7 months, received my registration.
17. Started sharing my perspective here on X.
Looking back, the charts were only part of the education. Working on myself became just as important.
Ab yahan bhi charts, trading psychology aur market ki baatein hongi. Seekhna abhi bhi jaari hai.
I’m Apoorv Dubey. Trader, author and SEBI-registered Research Analyst.
What brought you into the markets?
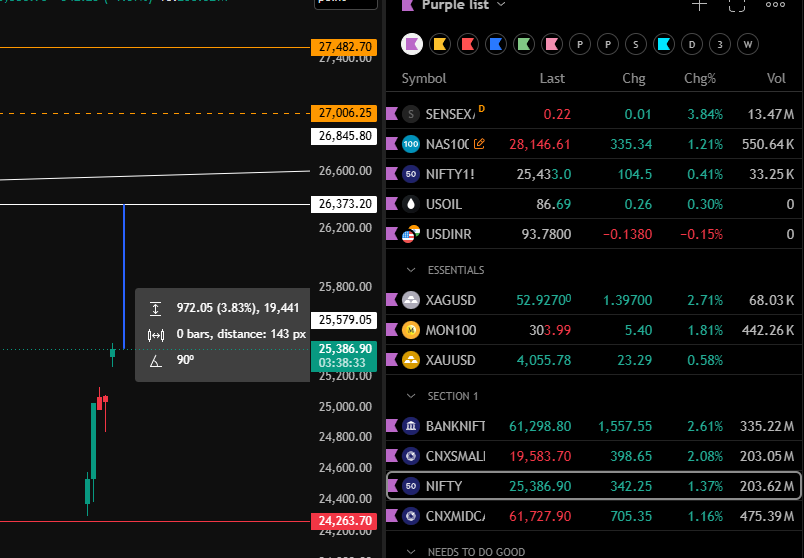
Headline - India’s retail inflation hits 6.09% in October, breaching RBI’s 6% upper limit as food prices surge.
My Views - Any Nifty retracement from here gets absorbed - I only see opportunities ahead. #Nifty#economy
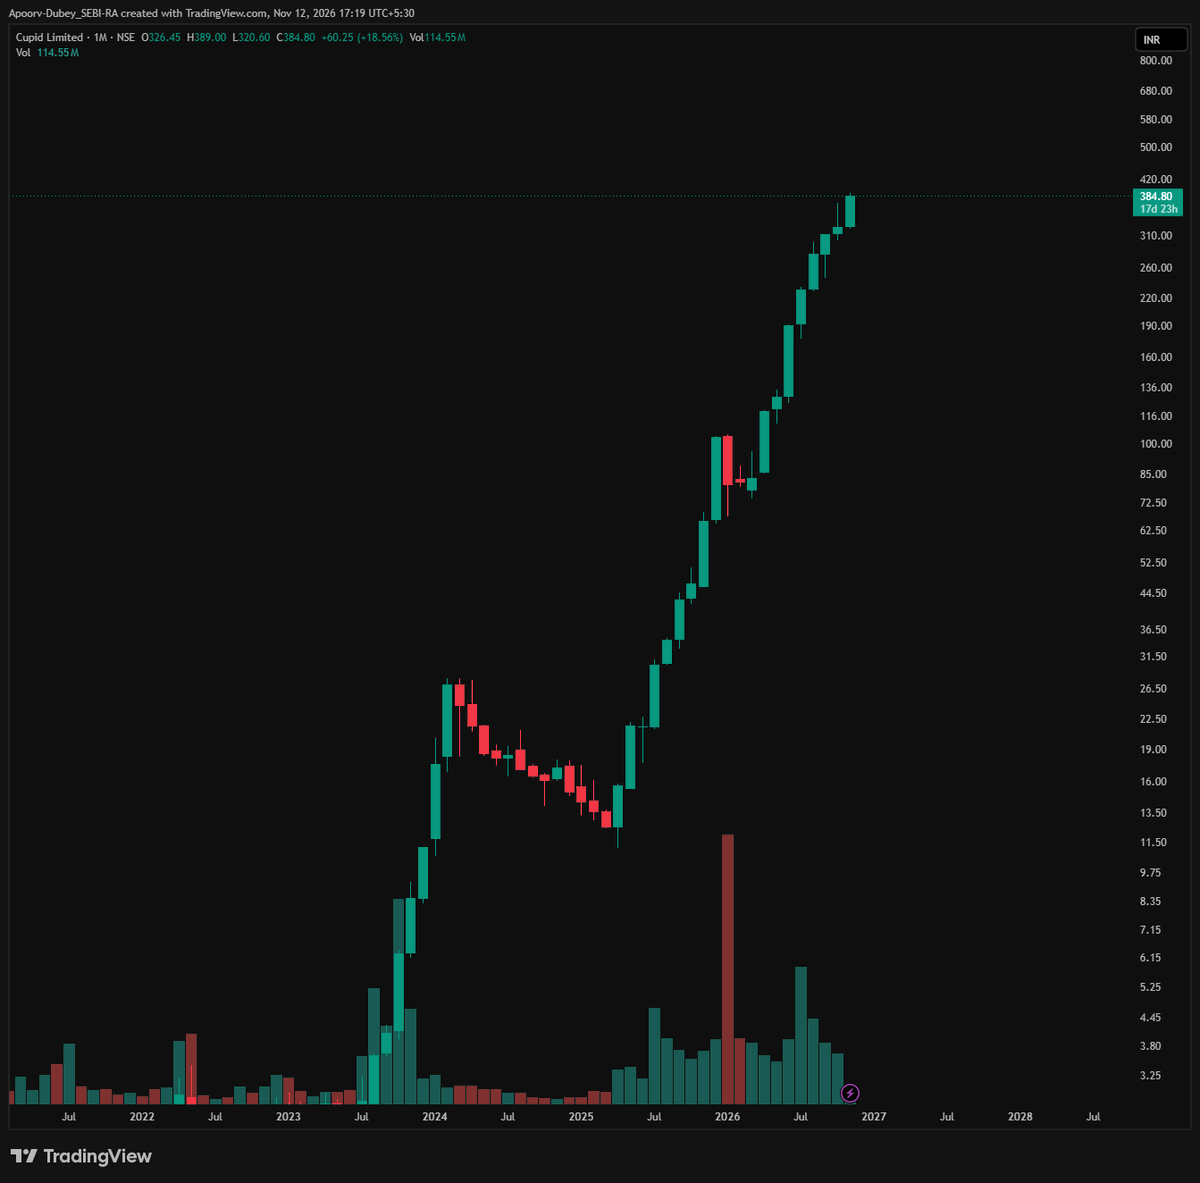
#CUPID (NSE) - charts look terrifying (parabolic monthly run to ~₹385–390), but the numbers keep justifying the move
-Great Numbers
-Great Guidance but
Hard to touch as a pure chartist 😅
#Stocks#StockMarketIndia#trading
#NiftyBank Outperforming Every other Index on the Basis of Hitting ATH first In the RECENT RALLY . Extremely Positive for Indian Markets in General as well.
Tanla Platforms - 3 Monthly time frame chart ( Long Term Time frame chart )
Waiting For the Stock to Close Strongly above the Counter Trendline .
Not yet Active . Keep on Radar Everyone .
Markets are Kind ❤️
Educational only. Not a Recommendation to Buy,sell or Hold .
#StocksToWatch #trading #Investing
( CHART 4 ) - S J Logistics: A monthly price action story 📊
• 2024 rally followed by a long correction
• Sharp move below the 50% to 61.8% Fibonacci zone
• Price recovered and returned to the descending trendline
• The running monthly candle has moved above it 👀
Was the earlier breakdown a shakeout? An interesting observation in hindsight...not a certainty.
Join my Telegram for more updates : https://t.co/Q9xOE8Y98n
Educational only. No buy/sell/hold recommendation.
#PriceAction #SJLOGISTIC #trade #Stocks
READING MATERIAL : https://t.co/JLr8Aew6Gs
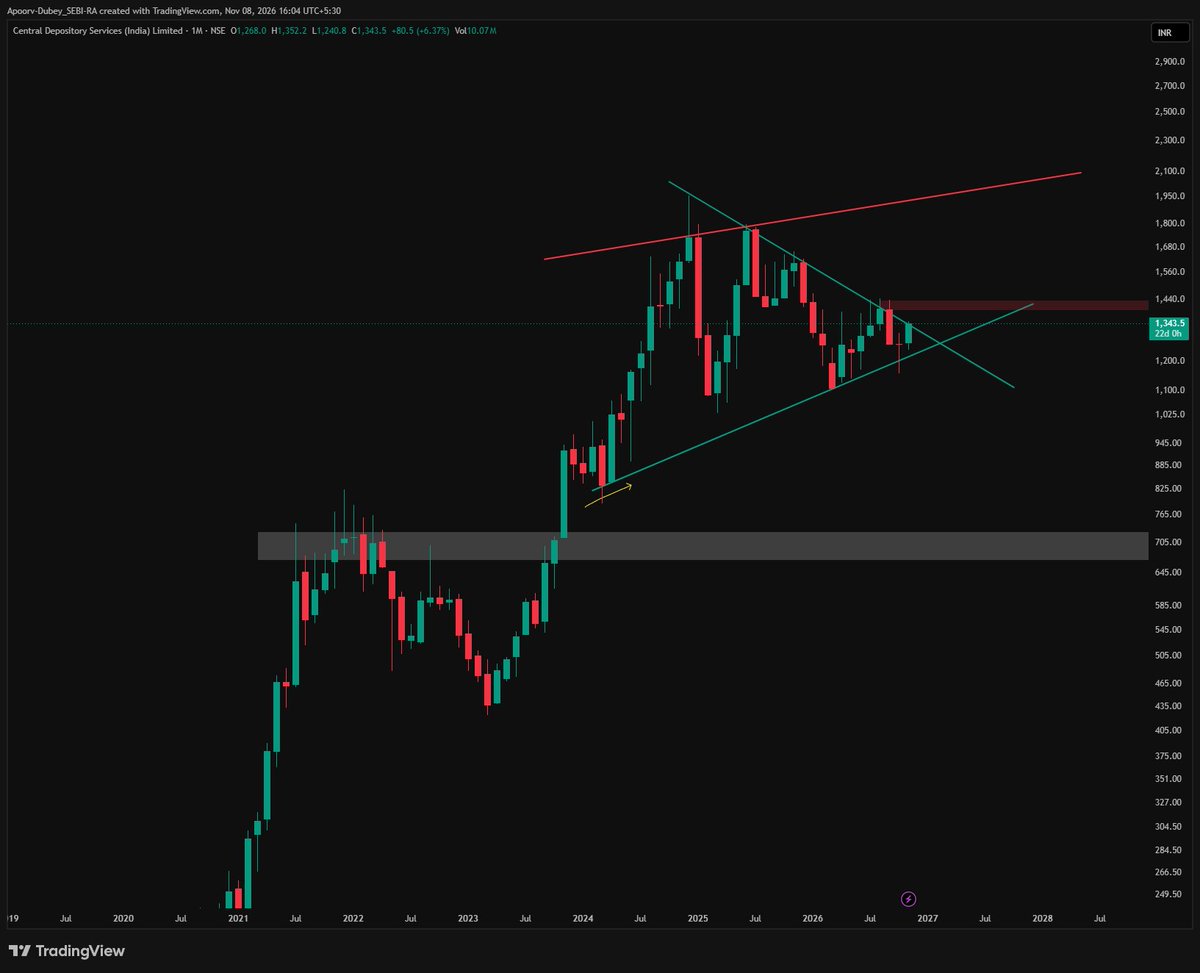
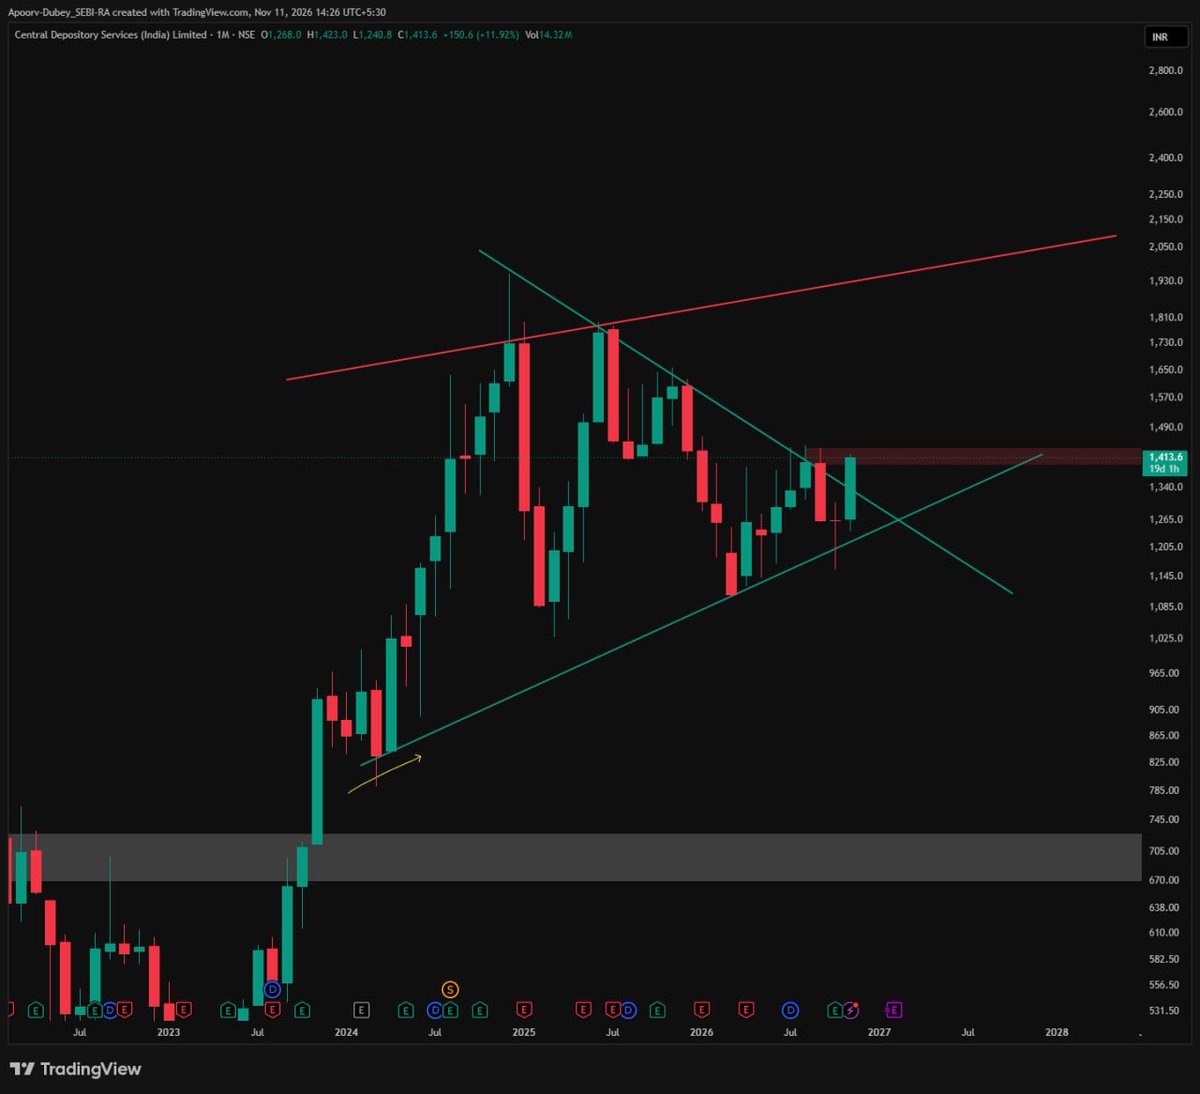
Shared this CDSL chart on Muhurat Trading day 🪔
Since then, price has moved above the descending trendline of its monthly consolidation pattern. 📊
The monthly candle is still forming, so I’m observing how price behaves around the line and where it closes. 👀
Join my Telegram channel for More Updates - https://t.co/Q9xOE8Y98n
Educational only. No buy/sell/hold recommendation.
#CDSL #PriceAction #swingtrade
🪔 Muhurat Trading 2026
Chart 3 - #cdsl
Long-term stocks on my radar sitting at strong base / support zones with breakout potential.
Educational only. No buy/sell/hold recommendation.
#MuhuratTrading2026#trading#investing
Chart 2 - #Meesho ( Time Frame - Monthly chart ) 📊
- MSCI’s November review announced Meesho’s addition to the India Standard Index.
- On the chart, price has moved above its first monthly candle’s high. The candle is still forming.
- I’m watching how price behaves around this area and whether a new structure develops. 👀
Educational only. No buy/sell/hold recommendation.
#priceaction #trading #Investing
https://t.co/vZg6UntDsV
Chart 1 ( 12 Nov ) - #Viyash Scientific: Two time frames, one price action study 📊
• 3M: Breakout from a large symmetrical triangle
• Price has returned towards its rising trendline
• Monthly: A smaller rising channel shows support nearby
• Both candles are still forming 👀
Educational only. No buy/sell/hold recommendation.
#PriceAction #trade #StocksToWatch
Reading Material : https://t.co/DX93OCN0e5
@laundrycult_ Sideways to Downtrend type structure can be seen as of now. Breaking the Major Trendline with BIG RED BAR means that and when there are no GAPDOWNS left to fill on the upper side but fairly many GAPUPs left at the bottom side to attract Liq
#CrudeOil Proper Sell of Rise movement after the Big Candle Breakdown .
-Marked zones are Gap Ups
-Yellow Line is Higher Time Frame Resistance
Dotted White line = Major Trendline ( Now Broken )
#PriceAction#TradingView
📊Chart 3 ( 11 Nov ) : #IndusTowers ( Time Frame - Weekly )
• Broader rising channel frames the weekly structure
• Price returned to an old supply-to-demand zone
• A smaller green channel formed inside the larger one
• The running candle has moved above the counter-trendline and smaller channel
The weekly candle is still open...Thursday and Friday remain. 👀
Educational only. No buy/sell/hold recommendation.
#PriceAction #StocksToWatch #trading
https://t.co/0CKYc8Y6xH
#CDSL - Monthly time frame chart
Waiting For the Stock to Close Strongly above the Counter Trendline .
Not yet Active . Keep on Radar Everyone .
Markets are Kind ❤️
#PriceAction#trading#Investing