My Trading career in a nutshell:
1. Cleared JEE Mains. Couldn’t clear Advanced.
2. Got into a good college.
3. Started my own startup during college.
4. Began sharing charts on TradingView and grew into a widely followed author.
5. Placement season arrived. Cracked two companies and joined a trading firm.
6. Learned about bond markets, energy products, STIRs, Euribor, SONIA and curve trading.
7. Started a YouTube channel. Crossed 10,000 subscribers.
8. Left the firm to trade independently.
9. Became a full-time swing trader in Indian equities.
10. Trading got tough. Kept working on one strategy, studying, practising and refining it.
11. Started taking the gym and meditation seriously.
12. Became increasingly interested in trading psychology.
13. Started writing down my thoughts. Those thoughts became my first book.
14. Learned publishing from scratch, hired professional editors and printers, and published “Trading Is an Emotion.”
15. Passed the NISM exam and applied for SEBI Research Analyst registration.
16. After 6–7 months, received my registration.
17. Started sharing my perspective here on X.
Looking back, the charts were only part of the education. Working on myself became just as important.
Ab yahan bhi charts, trading psychology aur market ki baatein hongi. Seekhna abhi bhi jaari hai.
I’m Apoorv Dubey. Trader, author and SEBI-registered Research Analyst.
What brought you into the markets?
@laundrycult_ Sideways to Downtrend type structure can be seen as of now. Breaking the Major Trendline with BIG RED BAR means that and when there are no GAPDOWNS left to fill on the upper side but fairly many GAPUPs left at the bottom side to attract Liq
#CrudeOil Proper Sell of Rise movement after the Big Candle Breakdown .
-Marked zones are Gap Ups
-Yellow Line is Higher Time Frame Resistance
Dotted White line = Major Trendline ( Now Broken )
#PriceAction#TradingView
📊Chart 3 ( 11 Nov ) : #IndusTowers ( Time Frame - Weekly )
• Broader rising channel frames the weekly structure
• Price returned to an old supply-to-demand zone
• A smaller green channel formed inside the larger one
• The running candle has moved above the counter-trendline and smaller channel
The weekly candle is still open...Thursday and Friday remain. 👀
Educational only. No buy/sell/hold recommendation.
#PriceAction #StocksToWatch #trading
https://t.co/0CKYc8Y6xH
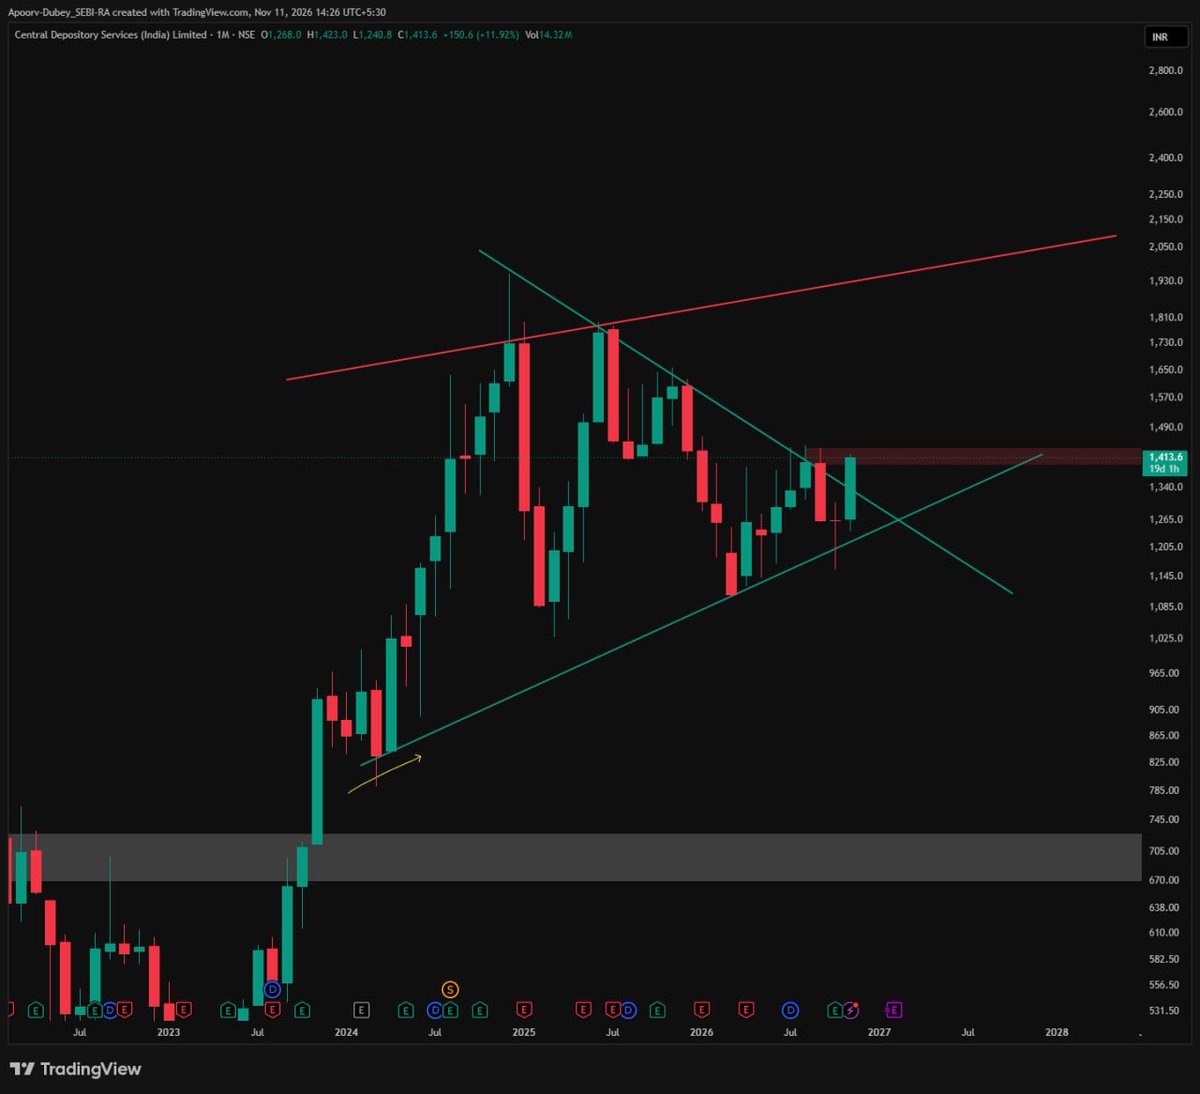
#CDSL - Monthly time frame chart
Waiting For the Stock to Close Strongly above the Counter Trendline .
Not yet Active . Keep on Radar Everyone .
Markets are Kind ❤️
#PriceAction#trading#Investing
Chart 1 ( 11 Nov ) : Kalyan Jewellers: Price Action Meets Earnings 📊
•On the monthly chart, price broke out of a long downward consolidation, followed by roughly three months of retracement.
• Q2 FY27 results: Revenue: ₹10,323 crore, up 31% YoY
and Profit: ₹427 crore, up 64% YoY; this included a one-time gain.
An interesting chart to study for how price behaves after a breakout and retracement. 👀
Educational only. Not a recommendation to buy, sell or hold.
#KalyanJewellers #PriceAction #Investing
@AyeshaTariq Its been working fine for me .. I have been using Premium for over 5 Years now - and I scan over 1000 stocks per month basis . @tradingview ?
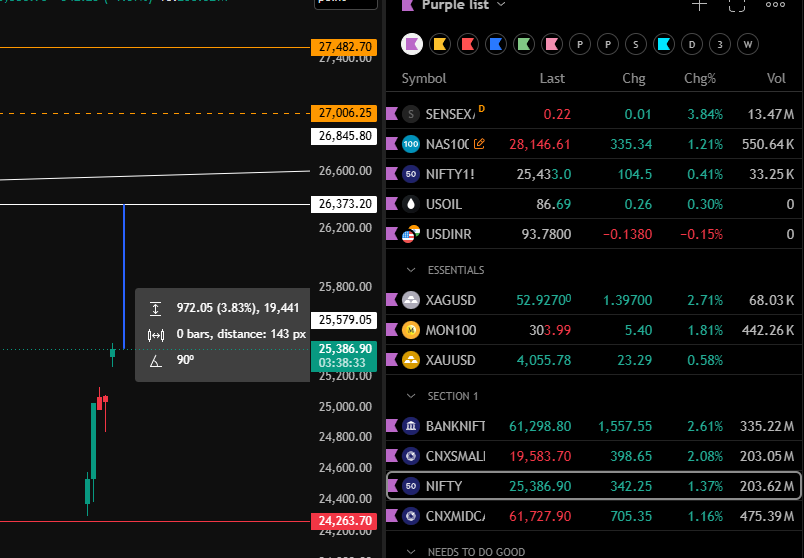
#Giftnifty Trading at 250+ Points , Another Gap up Open Tomorrow Morning . Everyone is Busy Looking for Nifty - I am Bullish on MID and SMALLCAPS - stock specific Action this year has been Amazing .
#PriceAction#trading
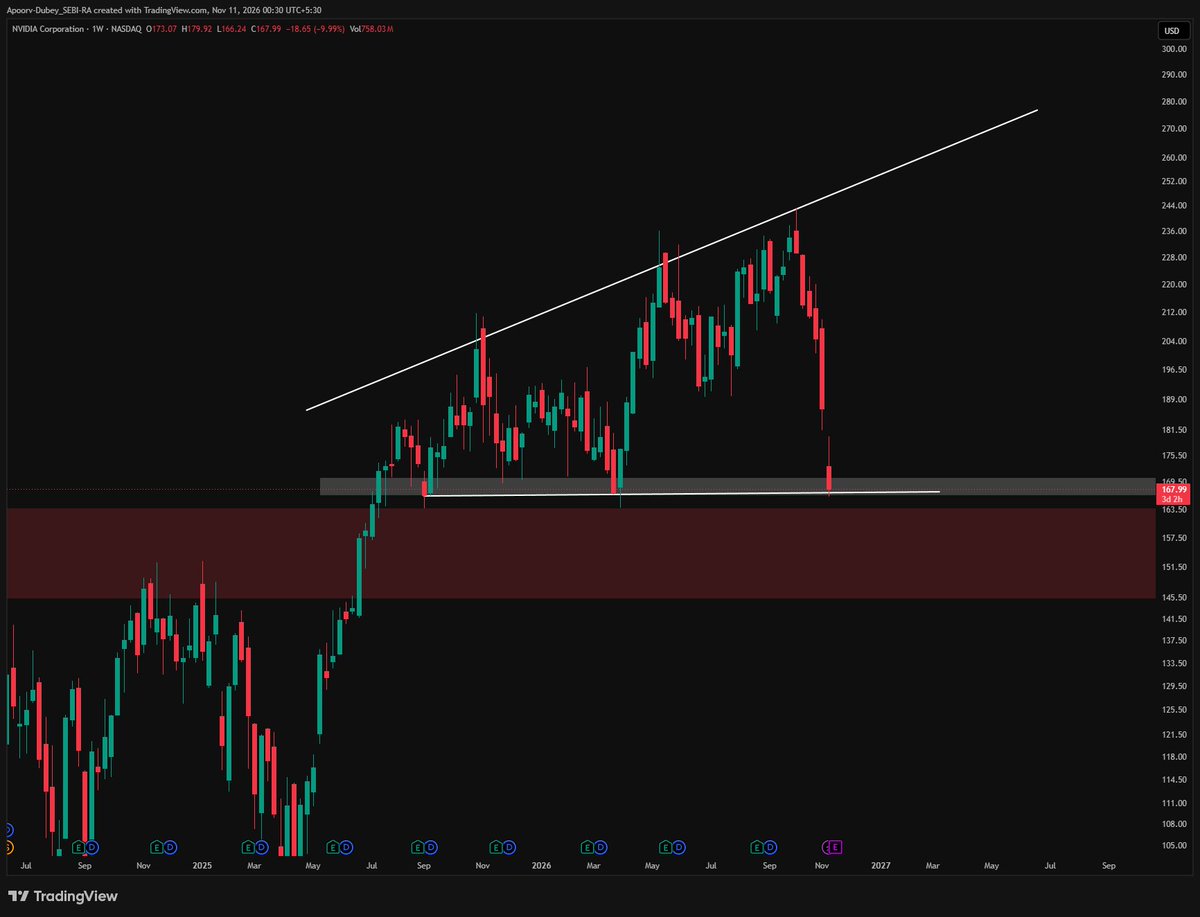
#Nvidia at a Weekly Time Frame Trendline Support, Earnings Next week . That will be a Trigger for this Level to Watch
#TradingEducation#Investing
Educational only.
3 stocks. 2 breakout strategies. 1 educational video. 📊
I’ve analysed #DLF, #GMRAIRPORT, Hindustan Petroleum and Nifty 500, showing how I read price action and study different breakout structures.
Watch the video and tell me which chart stood out to you 👇
🔗https://t.co/aU39pQHjaN
Educational only. No buy/sell/hold recommendation.
#PriceAction #TechnicalAnalysis
Silver: 46 years of price action in one chart 🥈📊
( Time Frames Used : 3Months and Monthly )
The old supply zone from around 1980 was eventually broken. Now, price has returned to test that area while also approaching a rising trendline.
Two levels coming together = a confluence zone worth observing. 👀🥈
What do you see on this chart?
Educational only. Not a buy, sell or hold recommendation.
#Trading #Investing #PriceAction #Silver
📉 Established names with
Filter 1 : 30–50% below their all-time highs
Filter 2 : ROCE Above 30%
Here are Six names trading substantially below their peaks:
• TCS: 45.6% below ATH
• Triveni Turbine: 44.3% below ATH
• Sanofi Consumer Healthcare: 42.0% below ATH
• Sharda Motor Industries: 41.4% below ATH
• Infosys: 41.1% below ATH
• CDSL: 35% Below ATH
#Trading #Investing #StockMarketIndia
Market corrections can bring familiar businesses back onto the research radar.Not a Recommendation to Buy, sell or Hold
📊CHART 3 ( 10 NOV ) Cochin Shipyard: A monthly chart to study
• Powerful rally followed by a long consolidation in 2023
• Price reached the 38.2% Fibonacci area Last Month
• Moved below the pattern, then returned inside - Classic Weak Hand Removal
• Current monthly candle is still forming inside its 1000 Days of consolidation
On my watchlist for price action observation. 👀
Educational only. No buy/sell/hold recommendation.
#CochinShipyard #PriceAction #Investing
Reading Material : https://t.co/zIrDb4Av2i