$QQQ Trader Guru AI Stock Analysis | Trader Guru Reviews
Limited index declines are masking significant stock-level weakness. With inflation risks resurfacing and earnings volatility driving sharp price swings, markets remain in wait-and-see mode before Friday's key jobs data.
@Venu_7_ Bought extra
$RKLB in July’s dip.
Avg cost $63 after entries at $59 & $67.
Up 30% this week. One of my highest-conviction holdings, aiming for a $200B valuation in 2–3 years.
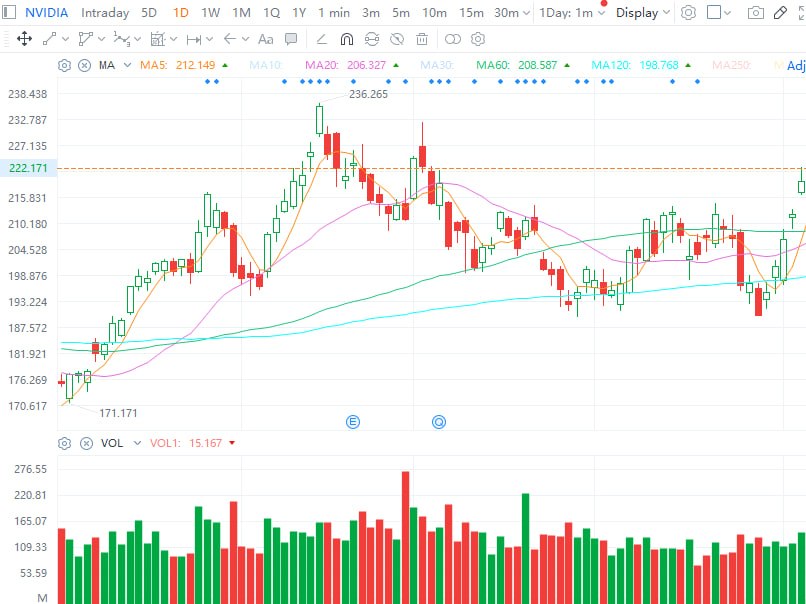
$NVIDIA rallied early then dipped, ending down 0.1%. It stays above the 5-day MA amid the tech pullback. Keep holding long on the 5-day MA support #trader Guru
$AMZN $QQQ Only 3 waves up from the lows. Today's move was consolidation above the breakout zone.
Trader Guru: 592 is the key. Break it to confirm the impulse wave. Fail there, and liquidation could come fast.
Watch the divergence.
@GlobalMktObserv Confirmed breakout for gold and silver!
Gold +2%, Silver up 5%.
200-day moving average is the next key level to test.
Will we see further upside breakout?
@optionflys $SPX $SPY $QQQ
Elliott wave hourly structure update.
Tomorrow’s nonfarm payroll data + weekly close on Friday will be key catalysts. Let price action guide the next directional move.
@LeifSoreide Cybersecurity leads tech technically. $PANW is due for consolidation; watch for a high tight flag setup. Avoid weak tech stocks without proper bases
@spotgamma SPX 0DTE volume fell to 56%, below its typical 60–70% range. As short-term positions were unwound, trading shifted toward longer-dated options, signaling a focus on larger moves ahead.
After a sharp decline, the Philadelphia Semiconductor Index has reached a key support zone. Last Friday, the index touched its first major stabilization range between 489 and 532 points.
@ohiain $UMAC’s 50% jump in four sessions didn’t happen randomly. Tracking early signs including relative strength, consolidation bases and pivot-level buying volume is a practical way to spot institutional accumulation ahead of explosive rallies.
If the S&P 500 holds this close, the TTM Squeeze is set to trigger.
It surged 20% within seven days after the March squeeze breakout last time.
Will history repeat itself for $SPY this round?
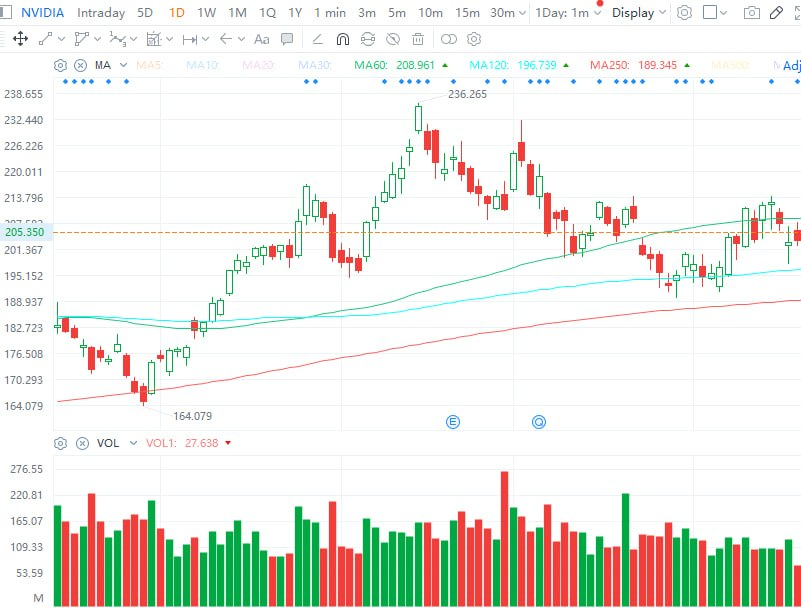
$NVDA trades sideways between the 60-day and 120-day moving lines in the short run. Sell near $214 and buy on dips to the 120-day MA. Hold core positions long-term and trade around them tactically
@MasterPandaWu $MSFT’s 27.7% four-day surge is an extreme short-term speculative jump. The linkage between its $500 target and SPX 7700 only depends on subjective technical analysis without fundamental support. The $550 double top serves as strong resistance, and a pullback is highly likely
Dow hits a record high, while the S&P 500 nears its peak. But is this the start of a new bull run or the final rally before a pullback? Big Tech earnings may reveal the answer.
@ZeeContrarian1 This $INTC ratio spread + short put is a mild bull play: protected down to $80, capped profit from $90.12-$119.94. The triple short 110 calls bring unlimited loss risk if the stock spikes over 30%.
US stocks are at a critical juncture, with the market focused on tech earnings. The semiconductor sector may remain highly volatile until the capital expenditure plans of the four tech giants are finalized.