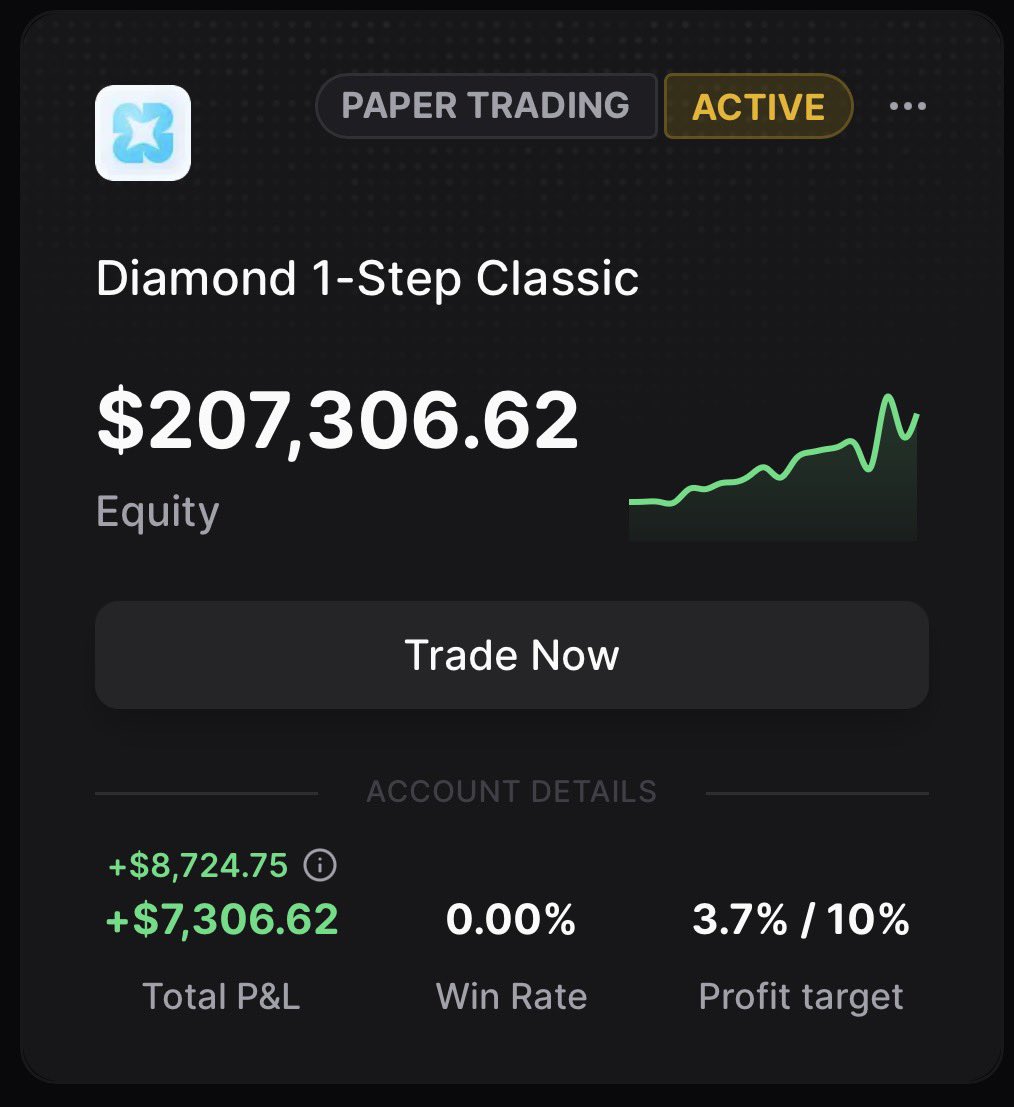
Just became a funded trader on @ProprXYZ
Still working on my 200k account - I think it would take little more time than 25k account.
I love the transparency dashboard and API support - now I can hook up with OMNISIGHT report and the trading API - this is a dream-setup for me.
Qualcomm gapped open 6.9% yesterday on a multi-generation AI data-centre silicon agreement with Amazon, ran to the intraday high, and closed near the session low — the bottom 17.9% of that day's range, on 25.6M shares. Both halves of that sentence are true and they point different ways.
The larger structure still reads constructive. The low lifted from early August to late August, the 10 August high of 168.87 was taken out at the intraday high, and daily RSI rose with those highs from 44.0 to 55.8 to 58.9. Momentum confirmed each new high, so there is no bearish divergence up there — the weak readings sit on the 1h and 15m.
What I don't like is the close. More than nine dollars off the high on triple volume is what distribution looks like, and also what a normal post-gap pullback looks like. The tell is the character of the next leg down into the empty zone the gap left behind.
Context: a recovery rally 33% below the yearly high, and the 16 September policy meeting is an unusual one where a hike rather than a cut is being discussed. Educational commentary, not advice.
Hedging $SOXL long position with $BTC short position on @proprxyz
Welcome to the property trading world:
https://t.co/3J4tq28iHv
Leveraging 99% of the margin sounds like a miracle if you know how to trade.
On September 3, Bitcoin printed roughly 950M in daily volume, the largest of the past 16 sessions. Four days later price is still boxed inside the narrow range that candle left behind. In Wyckoff terms this is the anatomy of a trading range: a climactic advance, a reaction, then a contraction where the information lives in volume rather than price.
The pullback since has been quiet. Completed sessions traded 164M, 251M and 383M, each well under half the impulse day. When supply genuinely dominates a decline, effort expands and sellers must pay up in volume to push price lower. That expansion never arrived. Contracting volume inside a narrow range after a high-volume advance is the classic signature of absorption.
Measured language matters here. Absorption is suggested, not settled: the evidence is consistent with accumulation without confirming it, and no spring has been confirmed. Note too that the latest 4h and daily bars are still forming, so their volume is understated by construction. Unfinished-bar volume can never be used as confirmation of dry-up.
Get the exact entry, targets, stop and full analysis with an OMNISIGHT REPORT membership. Link in profile. This is educational market commentary, not investment advice.
bitcoin:native is offering a clean Wyckoff lesson: reaction volume matters more than the pullback itself.
September 3 printed 950M volume, the largest reading in the 16-day sample. The next daily bars came in at 164M, 251M, and 383M. Price gave ground, but participation never expanded against the impulse. In Wyckoff terms, that is consistent with absorption inside a narrow range—not proof of accumulation, but evidence that supply has not taken control.
Confirmation would be a range exit with renewed participation. The main risk is data quality at the edge of the snapshot: the final 4h and daily bars are unfinished, so their volume is understated and apparent dry-up cannot count as confirmation. The amber CONFLUENCE ZONE is deliberately broadened for public observation, not execution.
Read the full OMNISIGHT report: https://t.co/ObJOzEFRQj
Not financial advice.
The ethereum-classic:native chart carries almost a full Wyckoff cycle in sequence. Read in order it tells you which part is running now.
Aug 18 printed 6.007 with daily RSI at 30.5 — a capitulation low with climax character. The +51% surge to 9.089 over four days is the automatic rally, and the Aug 30 pullback to 7.054 is the secondary test, held far above the climax low. Lows have since stepped up 7.054, 7.119, 7.584: a chain of last points of support, each saying supply came thinner than before.
Clearing the prior high at 7.695 is the Sign of Strength that completes the sequence, placing the tape late in re-accumulation. The 1H chart's confluence zone is where that broken high, the latest stepped-up low and the near and medium-term means overlap.
There is a trap in the volume. The current bar is a few hours old, so its 374,482 looks thin — but annualised to a full day it is roughly 2.56M against a 7-day median of 1.78M. Whether volume genuinely contracts on the next pullback is the confirming condition. Full analysis: https://t.co/3orXP6u9Fr
Not financial advice.
ethereum:0xc18360217d8f7ab5e7c516566761ea12ce7f9d72 has almost everything distribution needs: a lower high, two rejections at the range top, a clean reaction low at 5.197. Then the evidence Wyckoff requires came back the other way.
The test is effort versus result. If supply is in control, heavy volume should leave the close pinned near the bar's low — a lot of effort producing no result. The 12h bar that printed 6.32 did the opposite: volume rose 3.0x, from 184,445 to 547,834, and the close landed at 75.6% of the bar's range. That is absorption, not rejection.
Not a one-off. The three most recent completed 12h bars closed at 71.6%, 66.1% and 75.6% of their ranges. A structure that looks like distribution from afar but keeps closing in the upper half of its bars is not backed by its own tape.
The 1H chart's confluence zone is where two medium-term means overlap the retracement of this advance. One discipline worth copying: the final 12h bar closed at just 17.2% of its range and looks weak, but it is still forming, so it was excluded. Full analysis: https://t.co/xOPe7dWSRa
Not financial advice.
stellar:native broke its range floor and was immediately bought back. In Wyckoff that shape has a name: a spring.
The 0.15235 low printed with 12h RSI at 31.4 — a real exhaustion reading — and price recovered to 0.20 almost at once. A brief break below support followed by instant recovery is an accumulation range's final shakeout: the last holders are flushed and the inventory ends up with whoever absorbed the flush. The pullback to 0.171 that followed reads as a last point of support, and lows have since risen from 0.17717 to 0.18244.
Volume agrees. On the 12h series the thrust bar traded 767,677 against 742,469 on the comparable down bar. Rising lows with demand outweighing supply is what the 1H chart's confluence zone marks, overlapping a cluster of 4h and 12h means.
One trap sits in plain sight. The final snapshot bar is still forming, so its daily volume prints 321,823 against 1.1-1.37M on completed sessions. Pro-rated for elapsed time that is unremarkable, but read raw it misleads completely. Full analysis: https://t.co/q92dtZG2kf
Not financial advice.
$ARB ran 148% in a week and has now gone quiet. In Wyckoff that silence has a name and a test attached.
The Sep 6 daily bar traded 238.95M contracts, dwarfing the prior markup bars at 74.0-124.5M and the base before them at 25-60M. Peak volume at the apex of a vertical advance is the textbook climax signature: a very large amount of inventory changed hands. A climax is normally followed by an automatic reaction, and one arrived: -12.4%.
That makes the current bounce a secondary test — price returning toward the climax high to see whether the demand that showed up there is still present. The 1H chart's confluence zone covers where the advance began and where the reaction found its floor.
The test is settled by volume, not price. A stall beneath the climax high on unconvincing participation confirms distribution; renewed expansion through it means re-accumulation. One caveat cuts against it: neutral funding and shrinking open interest point to spot-led repricing rather than distribution. Full analysis: https://t.co/07UTVcCPou
Not financial advice.
$HOOD jumped 16% in two sessions on 2.54x average volume. A bar like that is either a ceiling or a launch, and the difference is not opinion.
Wyckoff never judges a heavy bar alone: it reads where that bar closed and what the next did. Sep 3 opened at 113.80 and closed at 124.72 near its high, with no upper wick to speak of, on 51.6M shares against a 20-day average of 20.3M. An exhaustion ceiling surrenders the move next session on heavy volume. Instead it held most of it at 122.11 while volume normalised to 23.7M. That is absorption.
The phase map is coherent: a spring at 83.68, re-accumulation through 91-100, a higher low at 100.68, then the push through 112.45. The 1H chart's confluence zone sits where that breakout level, the retracement and an unfilled vacuum overlap.
Wyckoff treats a backing-up retracement after a Sign of Strength as normal; the area it returns to becomes the last point of support. What matters is volume on the way back: quiet keeps the reading, expansion does not. Full analysis: https://t.co/ub80FYT1Gs
Not financial advice.
$SOXL bounced 25% off its low in four sessions. Much of that happened while almost nobody was trading. Wyckoff does not let that slide.
Credit first. The reversal at 98.72 is a genuine spring: that 12h bar carried 36.9M, the largest of the leg, and price broke the low and recovered immediately — the classic accumulation reversal. The Sep 4 weekday break was a real Sign of Strength too, on 19.6M and 34.2M.
Then the weekend arrived. Those 12h bars traded 2.3M, 3.4M, 8.0M and 9.0M, a fifth to a tenth of weekday turnover. Price rose because supply was absent, not because demand won, and the flattering 5.9x up-versus-down volume ratio comes entirely from the weekday bars.
So the 1H chart's confluence zone is anchored on the last stretch where real demand was verifiable, overlapped with the medium-term mean. In Wyckoff a back-up to the creek is the normal path after a break: it forecasts a pullback without negating the structure. What settles it is whether weekday volume returns on the test. Full analysis: https://t.co/CEzsWlsziq
Not financial advice.
Volume on $KORU has all but vanished over three sessions. Anyone who learned Wyckoff as shapes reads that backwards, and it is the costliest mistake here.
Drying volume normally means supply is exhausted. But those sessions span a weekend and the Labor Day close. The 64k-285k daily and 23k-150k 12h prints are not absent supply, they are absent participants — and Wyckoff reads intent from effort, so there is no effort in a session nobody attended.
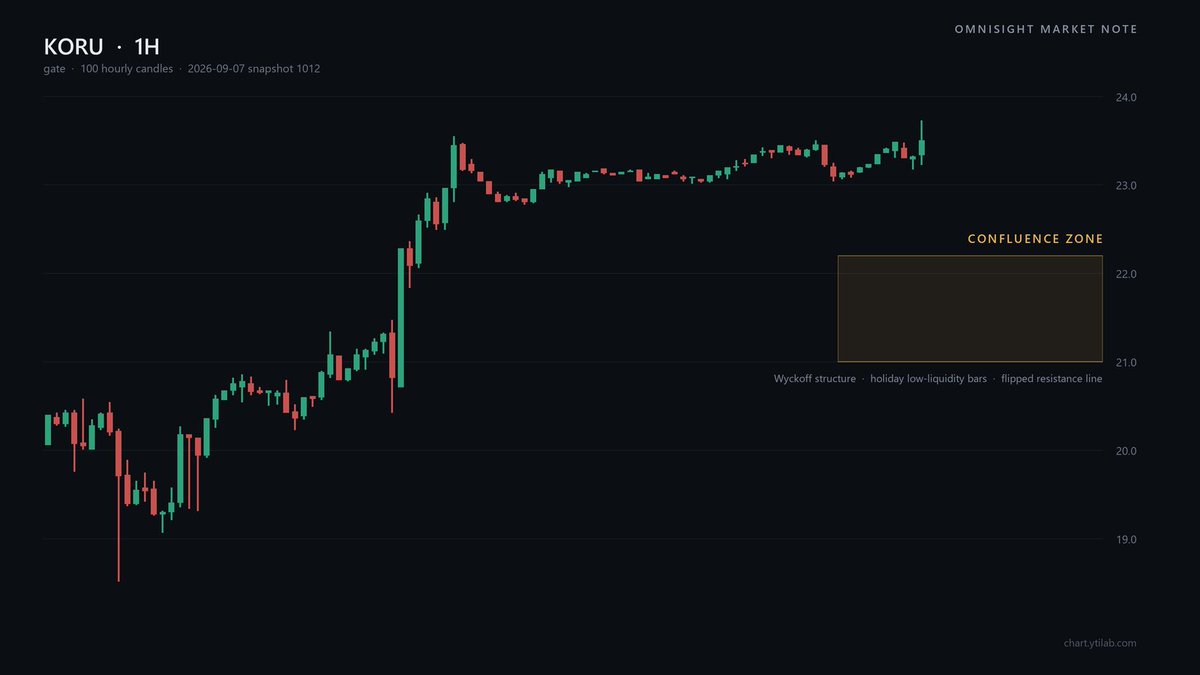
The phase call therefore rests on one bar. Daily lows stepped up 16.71, 17.65, 18.40 as supply was absorbed, then a 12h bar ran 21.27 to 22.89 and cleared the line capping the range: a Sign of Strength. The 1H chart's confluence zone is where that flipped line, the 12h mean and the impulse retracement overlap.
The confirming condition is narrow: the band must hold while volume genuinely contracts, on weekday bars where participation is real. A 3x leveraged product moves at triple the pace of its index, so a reversal arrives three times faster. Full analysis: https://t.co/uqJCLo3xFk
Not financial advice.
$BE spent months capped by the same ceiling. It has now cleared it, and how it cleared it matters more than that it did.
Wyckoff reads accumulation as a staircase of rising lows. From 157.33 the floor stepped up through 185.93, 197.50 and 210.02, and the push through 253.31 took out the top of that range: the creek. That is a Sign of Strength only if volume backs it. Sep 3 traded 15.64M and Sep 4 16.02M against a 10.6M average over the prior six sessions, with 21.50M on the Sep 4 12h bar. Real demand showed up for the break.
The confluence zone on the 1H chart sits where that freshly cleared creek overlaps the half-retracement of the prior decline and the mean of the recent advance. Wyckoff treats a return to this area, the back-up, as the normal path after a break.
One caution: the final bar in the snapshot is an incomplete print with zero volume, so reading it as supply exhaustion would overstate things. If closes settle back beneath the band instead, the break has simply been reversed. Full analysis: https://t.co/d3ihmlojyN
Not financial advice.
$CRM jumped 22% on earnings and has done almost nothing since. It looks like the boring part of the chart. In Wyckoff terms that is where information lives.
The Aug 27 gap traded 55.5M shares, clearing overhead resistance in one move — a Sign of Strength. Volume inside the range then fell in an almost unbroken staircase: 55.5M, 34.4M, 22.5M, 15.9M, 14.4M, 16.0M, 10.5M, back to the 9-14M it traded before earnings. Wyckoff calls that absorption: price holds not because nobody pushes, but because there is no inventory left to push with.
A second detail agrees: price has consolidated entirely above the gap without filling it, and no distribution behaviour has appeared at the highs. The 1H chart's confluence zone is built around that overlap: gap origin, range floor, first retracement shelf.
The honest caveat: decaying volume after an event spike is also just an event spike decaying. Absorption and fading attention look identical. What separates them is the next real test of that band. Full analysis: https://t.co/chpUS0K3vY
Not financial advice.
$SNOW printed volume five to six times normal and immediately gave back part of the advance. Every pattern book says climax. One question decides whether that label fits.
In Wyckoff a climax is exhaustion made visible: huge volume where demand is finally used up, then an automatic reaction. The shape fits. The Sep 3 daily bar traded 21.83M against a normal 3-4M, the 12h bar 27.64M against a usual 5M. But that session was the earnings date, and volume attached to an information event is a by-product of that information, not proof demand is spent.
A second trap sits in the same chart. The final 12h bar shows only 2.32M, which looks like supply drying up — except it has not closed. A phase call built on an unfinished bar rests on a number that does not exist.
So the 1H chart's confluence zone rests only on settled evidence: two moving averages from different lookbacks and the prior session floor, within a few dollars of each other. What matters next is volume on completed bars inside that band. Full analysis: https://t.co/l8hDqBeoms
Not financial advice.
$CRWD gapped roughly 20% on earnings, and the gap is not the interesting part. The eight sessions after it are: that is where a real breakout and a failed one cease resembling each other.
Wyckoff frames the pre-earnings slide from 197.25 to 181.24 as a shakeout and the Aug 27 gap as a Sign of Strength: 23.44M shares, 2.3x the 20-day average. Confirmation came next. The Sep 2 pullback traded 12.39M, about half the volume of the thrust that created it. A back-up to the creek on lighter volume is the textbook last point of support: absence of supply on the return is the evidence, not price.
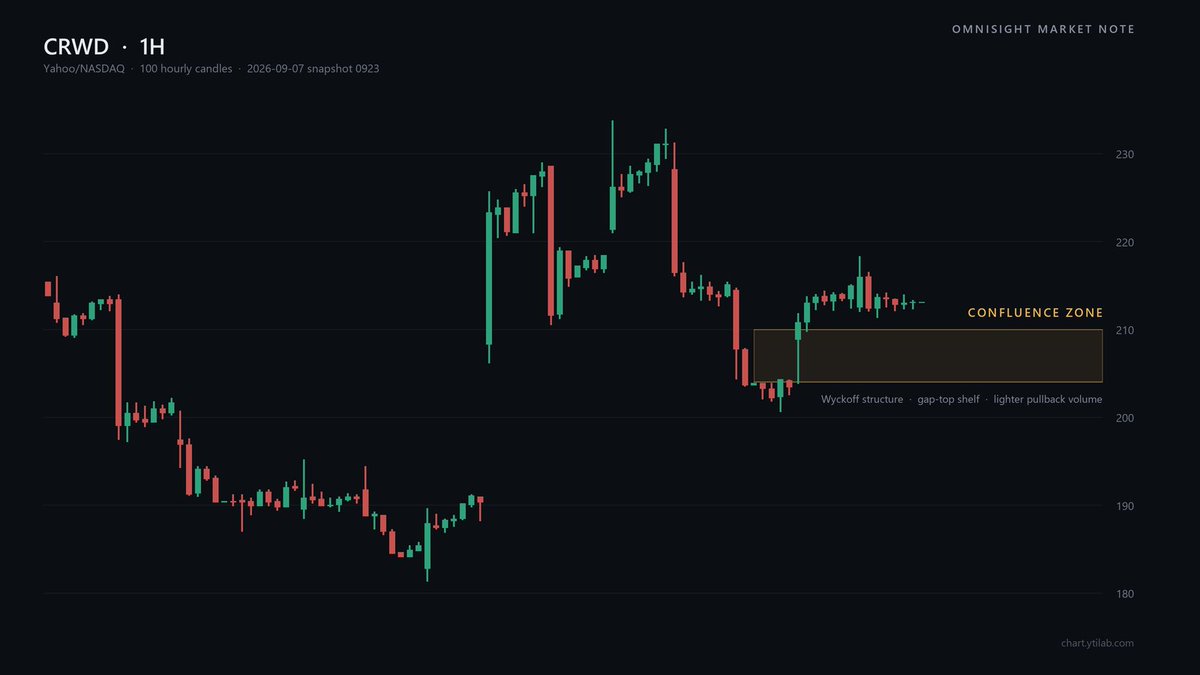
Four closes have since held above the top of that gap. That edge, the pullback floor and the near-term mean are what the 1H chart's confluence zone is drawn around.
The counterweight is honest: the down bars were never light, and the recovery sessions traded 12.07M and 8.42M against a 10.22M average — participation, not enthusiasm. Whether volume expands or dries out inside that band decides the next phase. Full analysis: https://t.co/H3znN0Ms7E
Not financial advice.
$SAP ran 45% off its July low in six weeks, then went quiet. Quiet is the part most people misread — the chart is no longer asking whether the advance was real, but who ended up holding the supply.
Wyckoff answers from volume, not price. The session that printed this pullback's low traded 1.51M shares against a 20-day average of 2.39M; the one that reversed it traded 2.39M, back at average. Weakness nobody feeds and strength everybody joins is a reaction inside markup, not the first act of distribution.
The highs agree: the late-August peak came on 3.03M against the 4-6M that carried the advance, so there is no climactic print where a ceiling would need one. The confluence zone on the 1H chart is drawn around that overlap — volume asymmetry, the daily mean, the prior swing shelf, the retracement pocket.
One condition decides it, both ways. If price settles beneath that shelf on above-average volume, supply has genuinely returned. A probe that reclaims on drying volume keeps the reading alive. Full analysis: https://t.co/b74Gvkolcs
Not financial advice.
If you are a prop trader, you would know why. I've been a paid trader on breakout for years but left it because of several reasons: horrible network, shitty ui/ux, unbearable slippage, no dashboard or anything displaying my trades. Discount coupon and referral system. Transparent report system.
Most of all, breakout only supports crypto and one or two RWA tradfi items. Liquidity has moved to Stocks and ETFs while breakout stuck at crypto only.
Yeap definitely @proprxyz wins. period.
@ProprXYZ guys my referee has a payment issue - this is a matter that should be addressed very promptly, because it is based on the "trust" of your system.
I've been contacting the team and yet waiting for the reply - can you ask @Oz_Meritocrat to support?
Many thanks
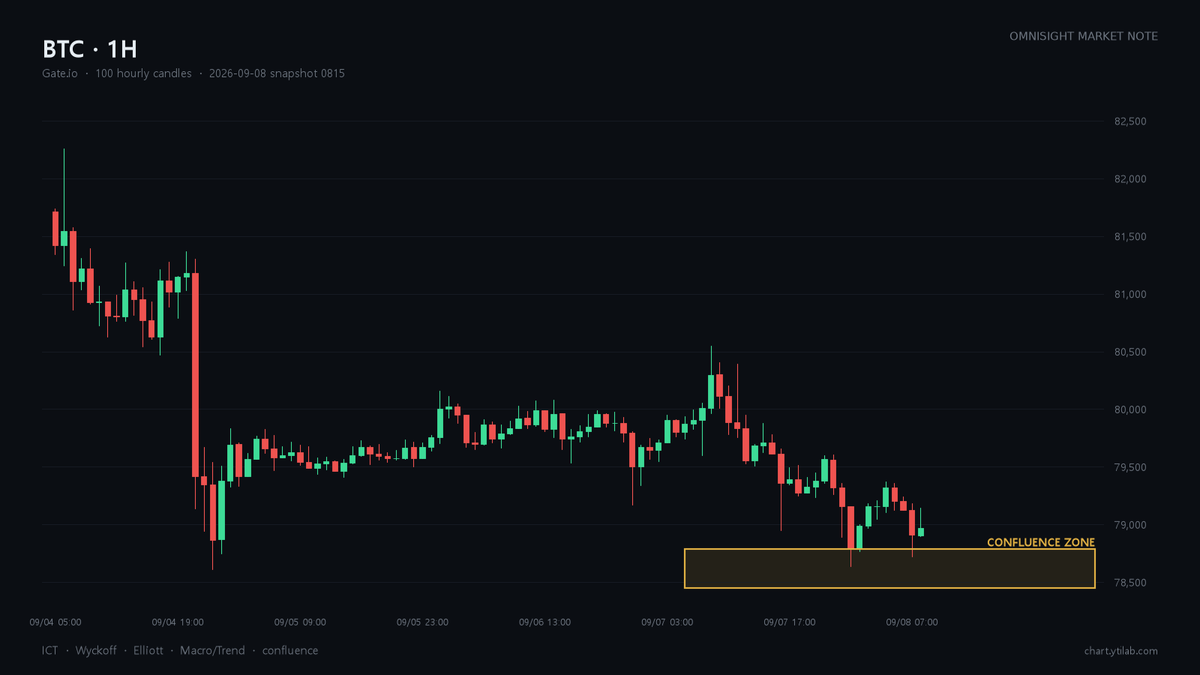
BTC 1H. Two quiet days under the Sep 3 high. A retracement area, the short-term mean and a prior swing low stack into one narrow band, on sell volume a third of normal. Watching that.
https://t.co/1jFDUptXgk
Not financial advice.