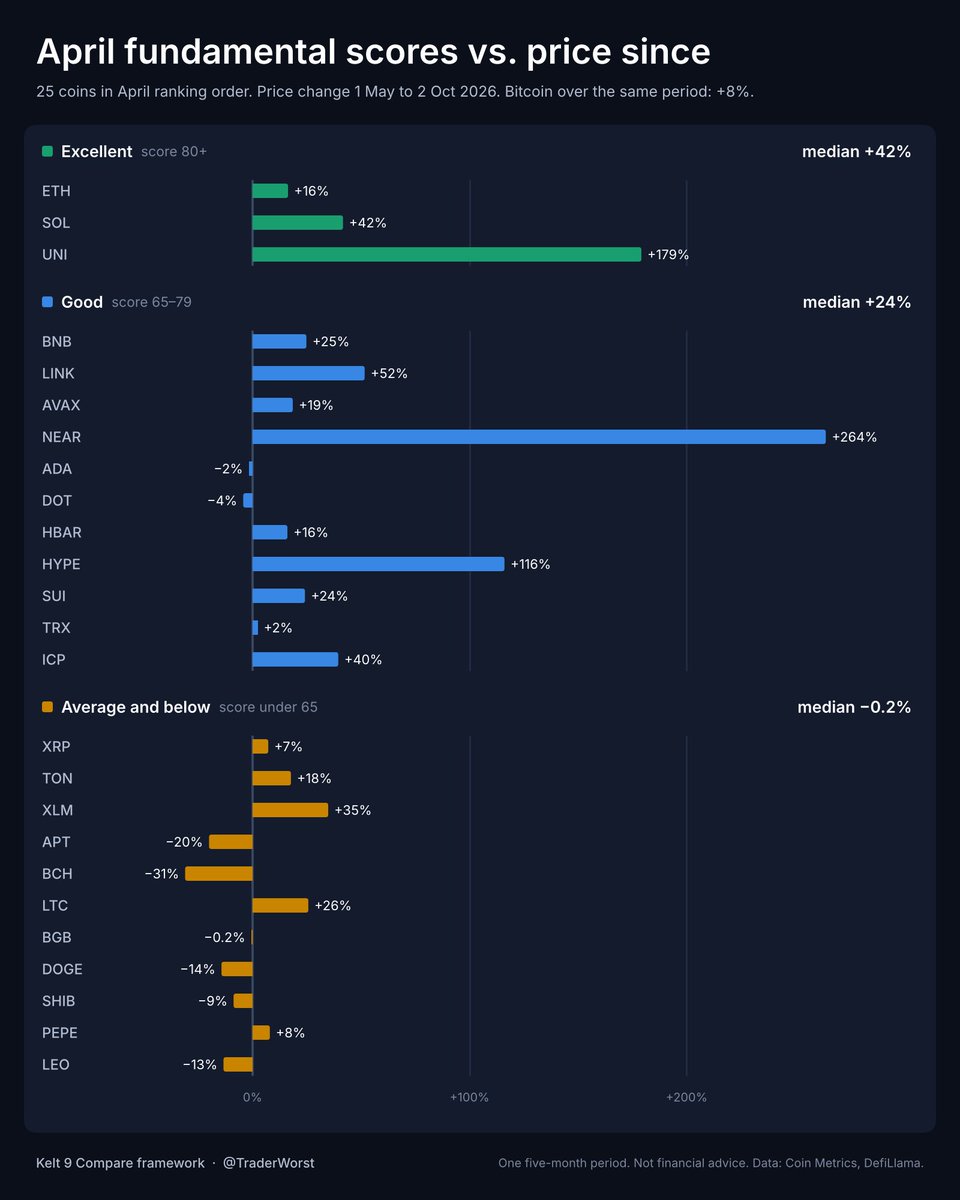
In April I scored the top 25 coins on fundamentals with the Kelt 9 Compare framework.
Five months later I checked those scores against price.
Coins that scored higher did better. All 25 are in the chart, in the April ranking order.
$11.3M in fees paid by users on the BNB network over the last 30 days.
The 30 days before that: $15.3M, a drop of 26%. BNB itself fell 24% in the same window, so fee revenue and price moved down almost in step.
$RAIN price change, last 30 days: -50%.
Bitcoin over the same 30 days: -22%. Both ended the month lower, and RAIN's decline runs much deeper than Bitcoin's. A price-only reading: the data holds no fee or usage figures for RAIN.
$LEO price change, last 7 days: +0.8%.
Bitcoin over the same 7 days: -13%. Opposite directions this time: LEO barely moved while Bitcoin gave up 13%. The data covers price only; no fee or usage figures for LEO to set against it.
$PEPE price change, last 7 days: -29%.
Bitcoin over the same 7 days: -13%. Same direction, far bigger move. Measured against the Bitcoin week, PEPE sits well below it, with no fees or revenue in the data to weigh against the price.
$BGB: 50 of 100 in October. Outside the 40 largest coins, last rating.
Capped, slowly shrinking supply and a low valuation against peers; held back by thin liquidity, issuer control, a barely used Layer 2 and the Bitget hot-wallet hack of 24 Sept (about $388M).
Fees paid by users on the NEAR network, last 30 days: $105K.
The prior 30 days: $224K, so fee revenue is down 53%. $NEAR lost 35% over the same 30 days; usage shrank faster than the price did. A small base either way.
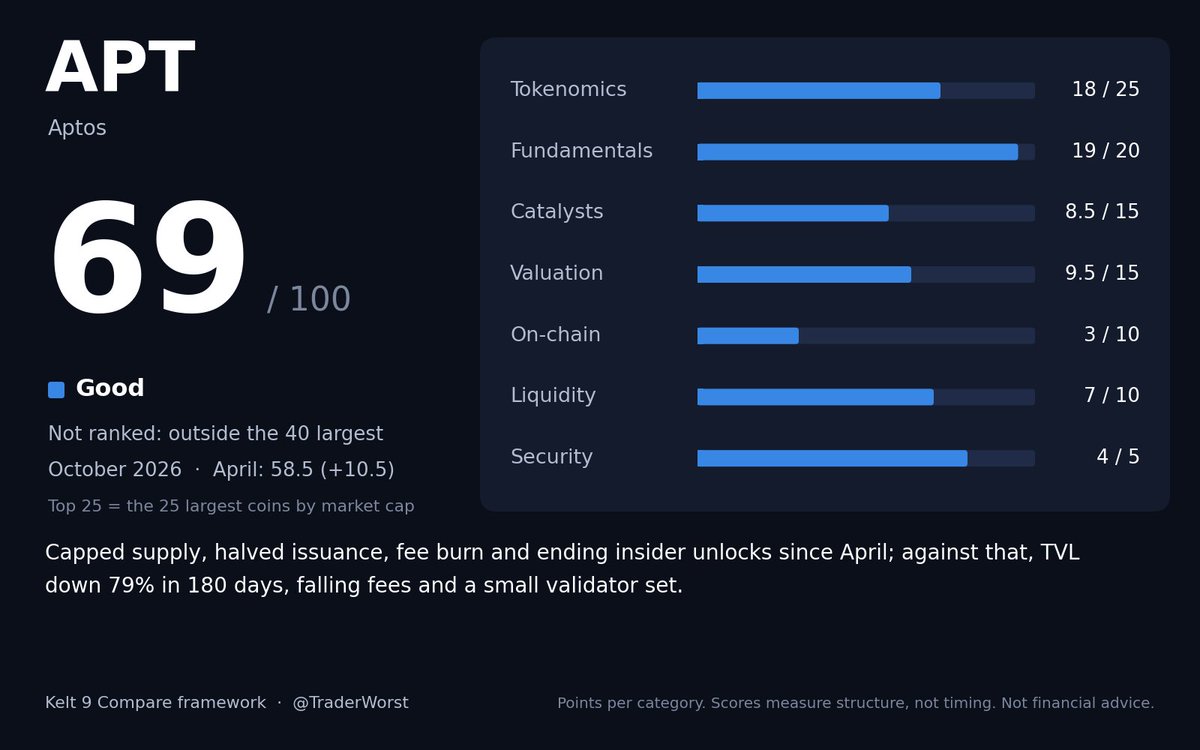
$APT: 69 of 100 in October. Outside the 40 largest coins, last rating.
Capped supply, halved issuance, fee burn and ending insider unlocks since April; against that, TVL down 79% in 180 days, falling fees and a small validator set.
$XRP vs. XLM in the October rating: 70.5 vs. 68.5 of 100.
XRP ahead: Tokenomics (14 vs. 11.5), Catalysts (12 vs. 10.5)
XLM ahead: Valuation (8 vs. 5.5)
Category by category in the chart.
Fees paid by users on Avalanche, last 7 days: $129K.
The 7 days before came in at $60.8K, so weekly fee revenue rose +112%. Still a small base for a network of this size, but the week-over-week direction is clear in the data.
1 of 29: rated coins that trade higher than 7 days ago.
The median 7-day change across the rated set is -12%, matching Bitcoin's -12% over the same week. The other 28 all closed the 7 days lower.
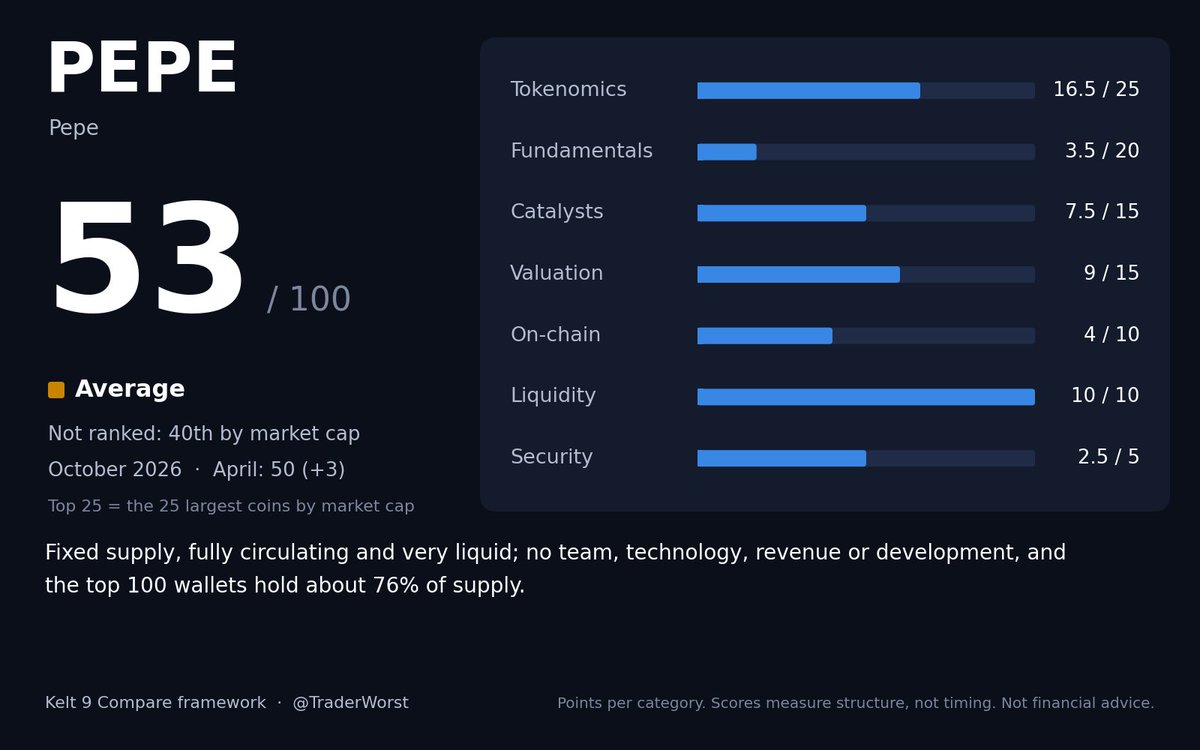
$PEPE: 53 of 100 in October. Outside the top 25 by market cap, still scored.
Strongest: Liquidity 10/10
Weakest: Fundamentals 3.5/20
Fixed supply, fully circulating and very liquid; no team, technology, revenue or development, and the top 100 wallets hold about 76% of supply.
$ICP: 71 of 100 in October. Outside the top 25 by market cap, still scored.
Fully circulating supply, slower minting and a fee burn tied to compute use, plus original technology; held back by small fees and TVL, no hard cap and a permissioned node set.
GRAM (TON network): +9.3% over the last 7 days.
Bitcoin ended the same 7 days at -9.4%. One week, two opposite results: $GRAM gained about as much as Bitcoin lost.
RAIN over the last 7 days: -39%.
Bitcoin finished the same 7 days at -7.4%. Both closed the week lower, with the $RAIN decline running well ahead of Bitcoin's.
$DOT: 69.5 of 100 in October. Outside the top 25 by market cap, still scored.
Hard cap and no unlock overhang, strong tech and decentralization; held back by tiny fees, small and shrinking parachain DeFi, the Moonbeam shutdown and a withdrawn ETF filing.
$SHIB: 58 of 100 in October. Outside the top 25 by market cap, still scored.
Fixed supply, no unlocks and a broad holder base; held back by a pseudonymous team, a Layer 2 that is barely used, no revenue and a weak meme sector.
Bitcoin Cash: -14% over the last 7 days.
Bitcoin fell -3.5% in the same week. Both ended the 7 days lower, but the $BCH drop was several times the size of Bitcoin's.
+13%: the $XMR price change over the last 30 days.
Bitcoin is at -10% for the same period. Monero ended those 30 days higher while Bitcoin ended them lower, so the two moved in opposite directions.
$XRP: 70.5 of 100 in the October rating, rank 13 of 25.
Strong team, technology and institutional access; held back by Ripple's 37% holding with monthly escrow releases, tiny fee burn and a market cap far above payment peers.
$TRX vs. ADA in the October rating: 73.5 vs. 72.5 of 100.
TRX ahead: Valuation (11 vs. 6.5), On-chain (7.5 vs. 3)
ADA ahead: Tokenomics (20.5 vs. 17.5), Security (4.5 vs. 2.5)
Category by category in the chart.