Introducing my game-changing scanner to identify high-potential stocks for swing & positional trading. Focus on pattern breakouts, range breakouts, pullback bounces, and uptrends. Read the complete thread to understand more on this. ✨
https://t.co/YOKhbU3lk8
If a stock feels like it has run up a lot, that's exactly the one you should be buying first. Every 10x stock was once a 5x, 4x, 3x, and 2x.
Don't fear the momentum — ride it. ⚡️
Found #CARYSIL to be technically great when I was going through my 12WK high volume screener in NSE. Great structure. Just look at the volumes in weekly chart. Full of tennis balls.
Nothing offbeat in fundamentals too. Steady increase in profits for the last 4 years and increase in FII & DII allocation in last 4 quarters. 📈
Stock moved just 25% in last 4 years. Won't matter if it falls another 15% to the accumulation zone & 30wma. Definite watchlist & observe keenly. Good steam ahead.✅
#NSE #stockmarket #priceaction
#NIFTYPHARMA Keep track of Pharmaceutical stocks from NSE. Good consolidation & breakout after 18 months in an already established Stage 2 structure. Pharma stocks with good RS and are already in Stage 2 in alignment with the sector should do well. #NSE#Stockmarket
Introducing my game-changing scanner to identify high-potential stocks for swing & positional trading. Focus on pattern breakouts, range breakouts, pullback bounces, and uptrends. Read the complete thread to understand more on this. ✨
https://t.co/YOKhbU3lk8
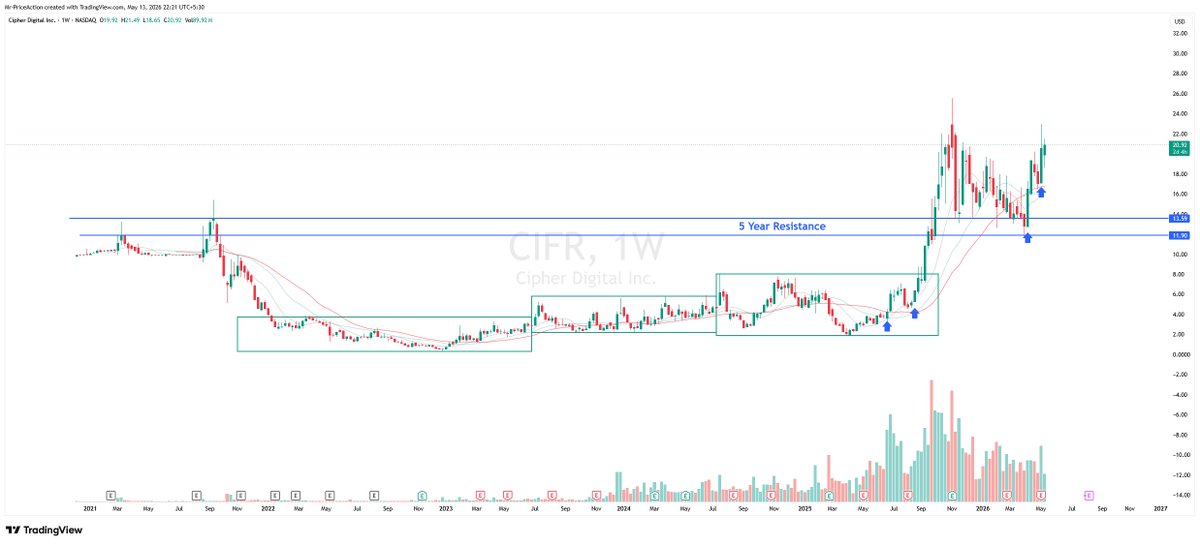
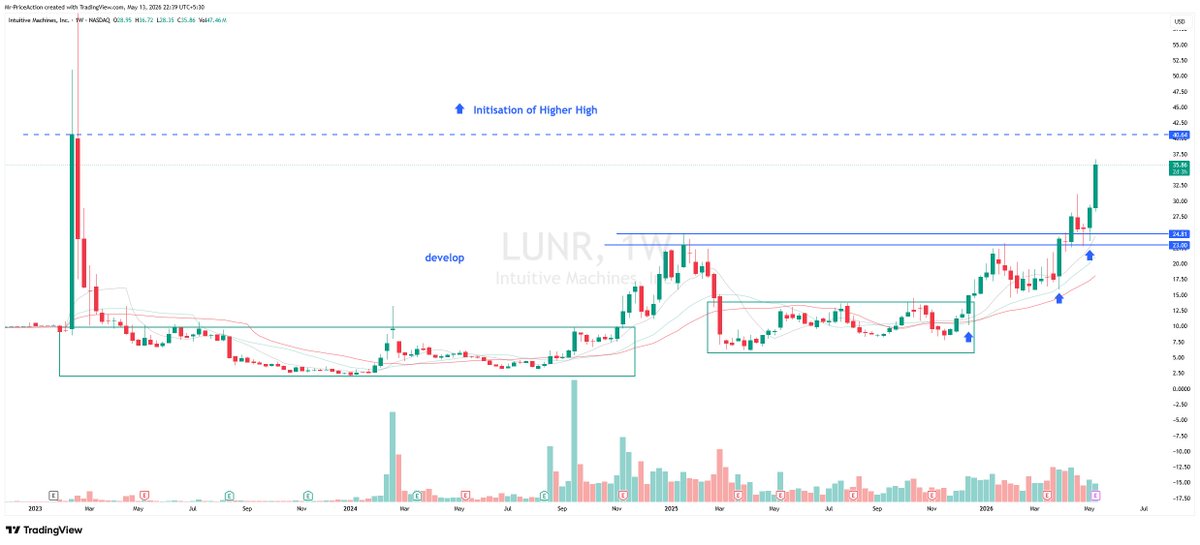
$ASPI from NASDAQ (US) & #HFCL from NSE (INDIA)
HFCL moved 100% + after this breakout
What will ASPI do now? Can we see a good move ahead?
A random Indian stock in weekly TF matches almost 90% of the price action structure with a random US stock in Daily TF. Why? How?
In technical analysis, patterns exhibit fractal properties, meaning that the same patterns repeat across different time frames, stocks & even charts from another exchange.
A chart pattern visible on a longer-term chart is equally relevant and valid on shorter-term charts, offering a consistent framework for analysis.
#NASDAQ #NSE #STOCKMARKET
#HFCL delivered over 100% gains in just 5 weeks. 📈
Technical Reason: Check the 3M chart first, then see the Weekly chart attached below. Look at the beautiful tennis ball price action.
Fundamental Reason: Observe the sharp improvement in OPM and PAT between Mar 2025 and Mar 2026.
Massive buying in HFCL was seen in the last week of Dec 2025, right before the results — a strong hint of insider buying. The stock was sitting comfortably in a solid support zone. Soon after, OPM jumped 530% and Net Profit surged 450% in just two quarters followed by another splendid quarter of Mar 2026. 👏
The tight consolidation followed by a clean breakout was a textbook blind buy for those who understand price action and volume. Keep it simple. ✅
SANDISK $SNDK
If you had invested 1000$ on Sep 2025, you will now have 28000$ which is 2800% in gains.
Script moved from 52$ to 1500$ in no time. It's an Indian equivalent of 1 lakh becoming 28 lakhs in just 9 months. 📈
Where it all started?
A clean IPO base breakout & never giving up 10wma which is also 50dma. Simple Price Action. Insane result.
#APOLLO#Tennisball#PriceAction
Definition of Tennis Ball can be anything but for me it's always the dullness in volume when the stock is going for a period of consolidation without disturbing the Price Action structure with ugly candles. Apollo Micro Systems is one great example for that. Self explanatory image attached. 📈 #NSE #stockmarket
Historically NIFTY has pierced 30 monthly sma with strong close (Wide Range Canlde without any demand) thrice including March 2026. Unless it's taken out immediately like in Feb 2016, we are in for a trouble. 📉
Many people comparing it with Covid Crash is not relating it to the demand that came at the end of March 2020. Current fall & close is different. ✅
Please position Your self properly and follow risk management. #NIFTY #NSE #Stockmarket
On 29th March 2020, I decided to learn stock markets. 📈
It's been 6 years in the blink of an eye and that thought keeps coming back: Even if someone offered me a huge sum for the exchange of that tiny part of my brain which holds all my trading knowledge, I wouldn’t take it. 🫠
I’m saying this so that people get to know how much real irreplaceable learning comes from analysing charts 3+ hours every day which accounts to 8000+ hours of dealing with real time trading decisions & experiencing the emotions associated with it. ✅️
It’s not easy. With time it gets a little easier, but it takes relentless effort to understand price action and the story behind each candle, plus a few lakhs lost along the way as tuition fees to the market. 👍🏽
Im proud of myself for the display of such effort in a skill which will pay me more than anything in near future. 💯 God Speed 🌟